Capture details while they are fresh
Log symptom, body location, intensity, time, context, and notes in one private place.
 Flojas Symptom Journal
Flojas Symptom Journal helps you record symptoms, review local history, analyze patterns, and export your own records. No account. No cloud sync. No automatic upload.
Important: Flojas Symptom Journal is not a medical device and does not diagnose, treat, cure, prevent, monitor, triage, or provide medical guidance.
When headaches, pain, fatigue, nausea, dizziness, sleep issues, or other symptoms happen over time, people forget the exact day, intensity, location, context, and whether things improved or worsened. Flojas turns those scattered moments into structured history, graphs, and user-controlled reports.
Log symptom, body location, intensity, time, context, and notes in one private place.
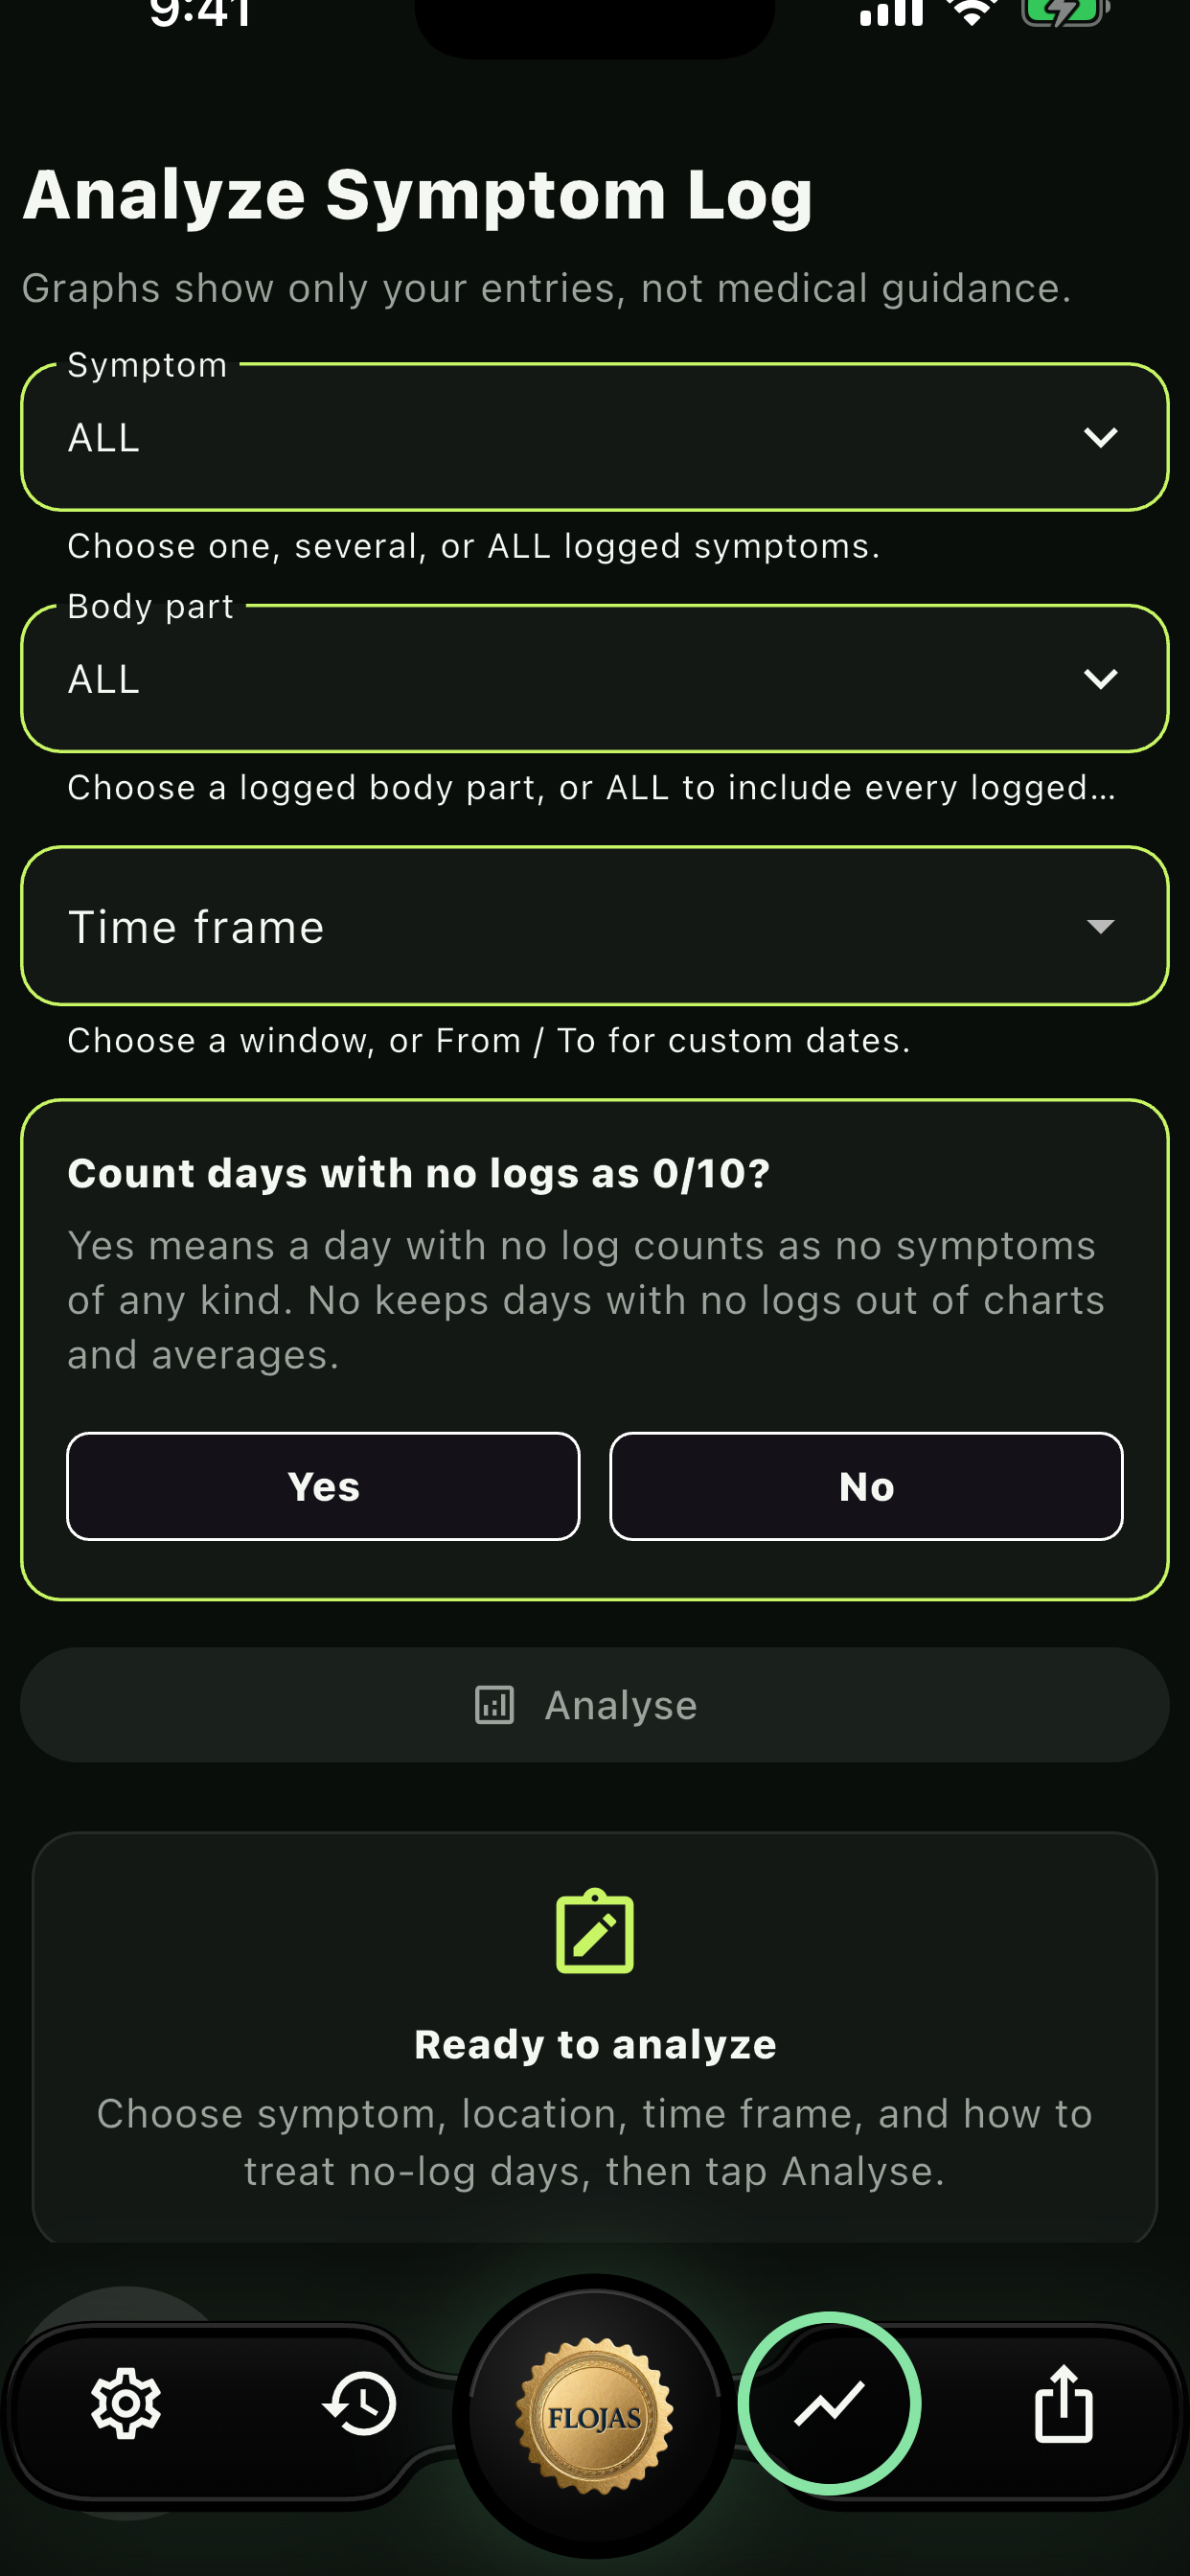
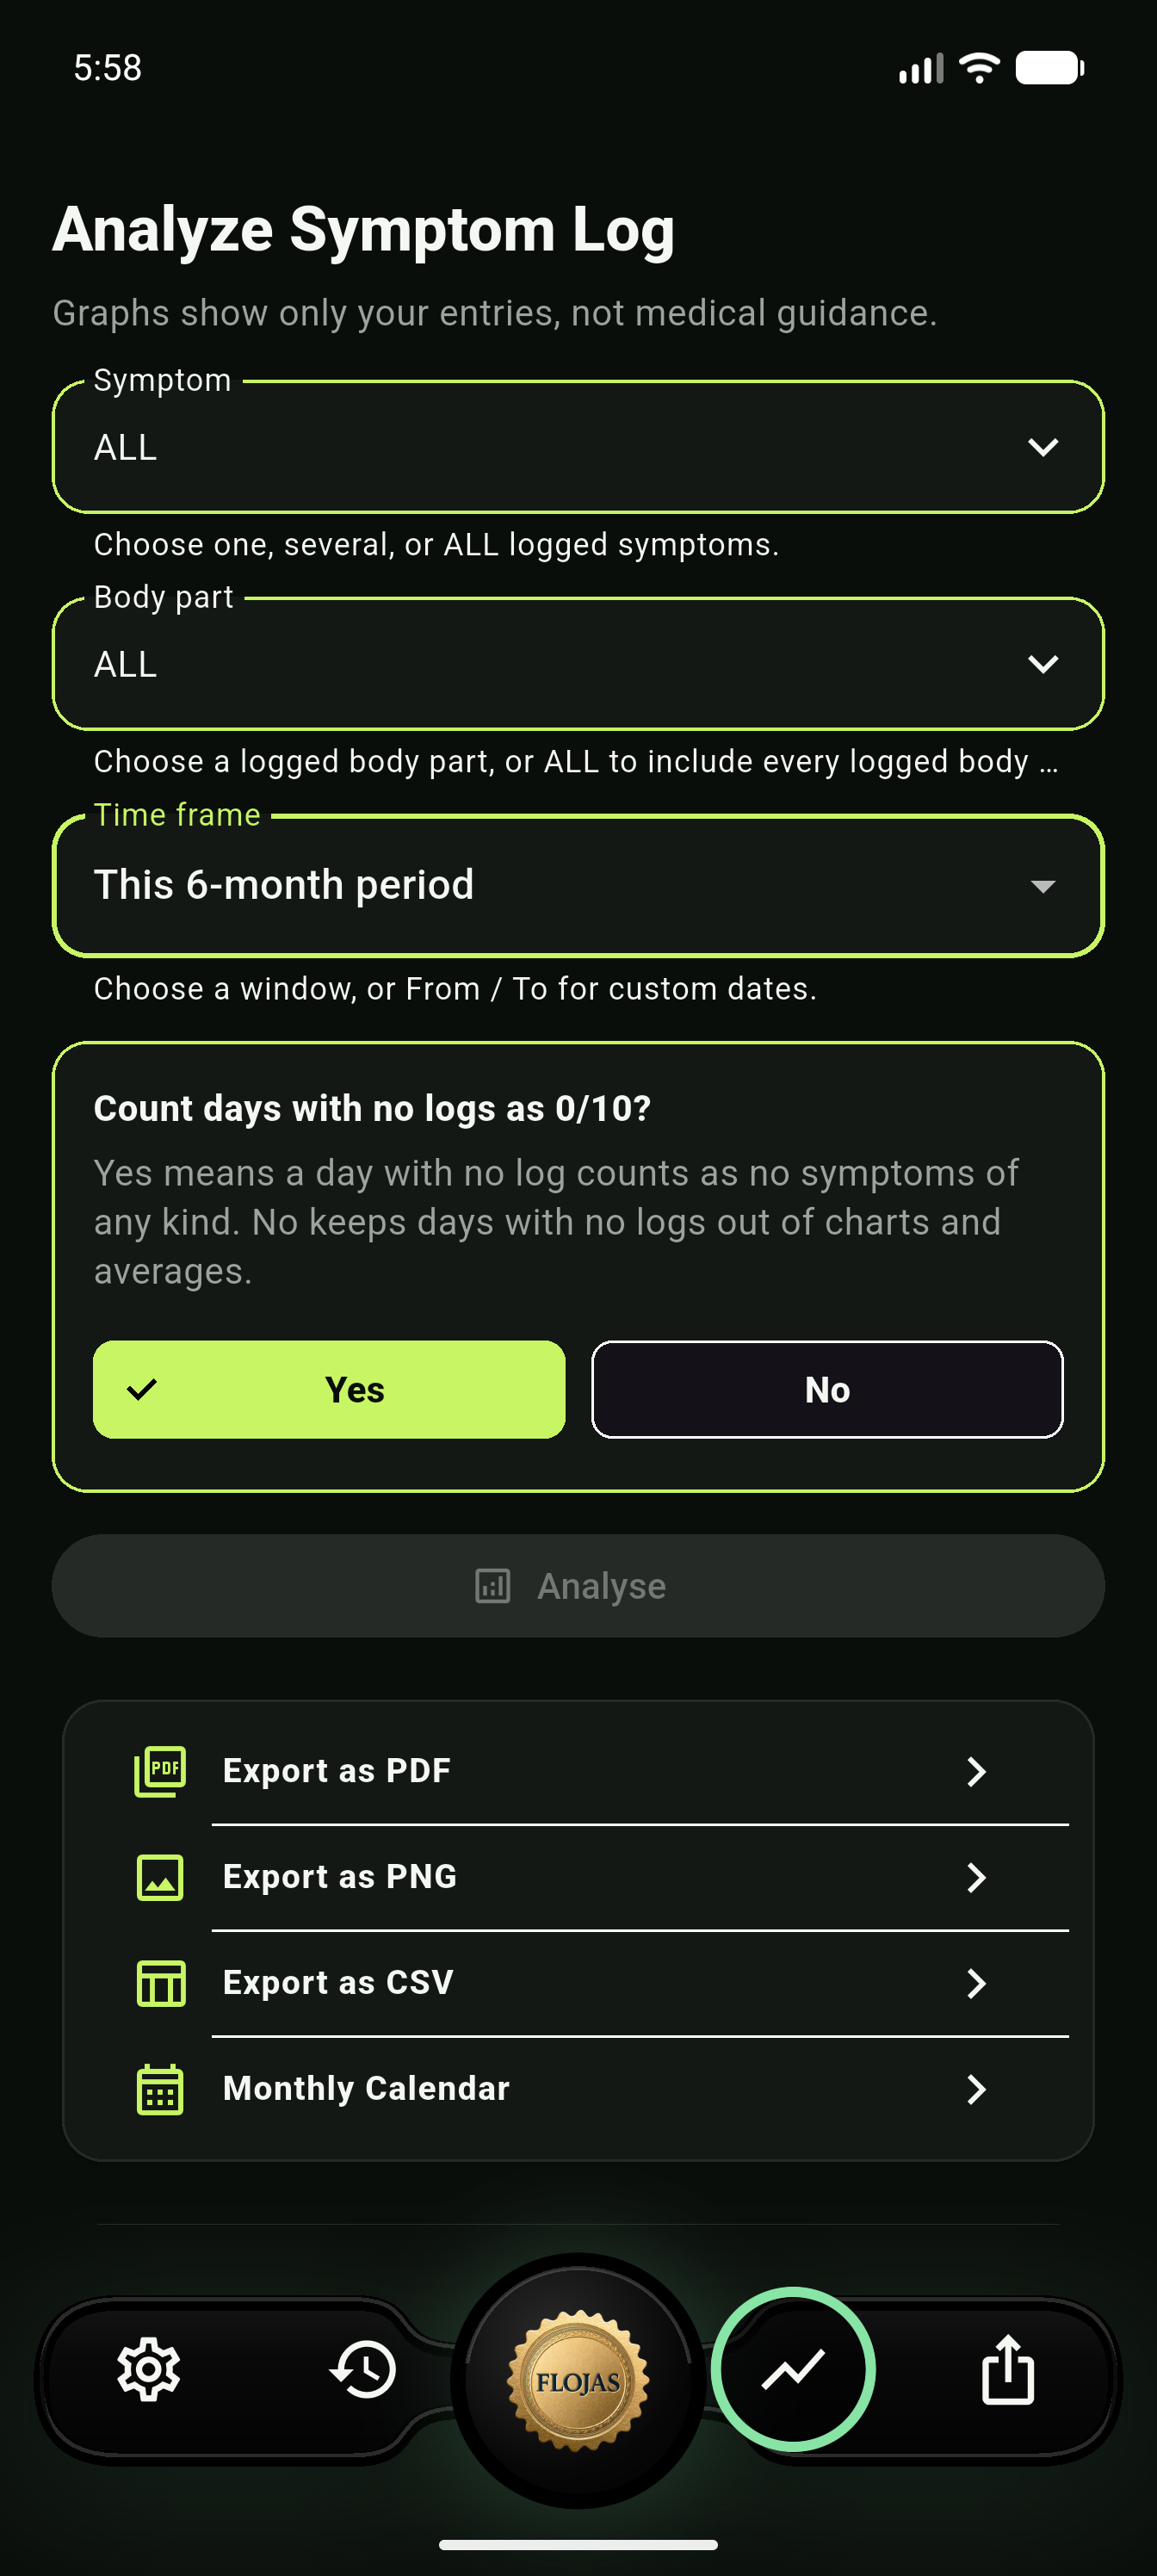
Analyze all symptoms together, or focus on one symptom and body area across daily, weekly, monthly, or custom windows.
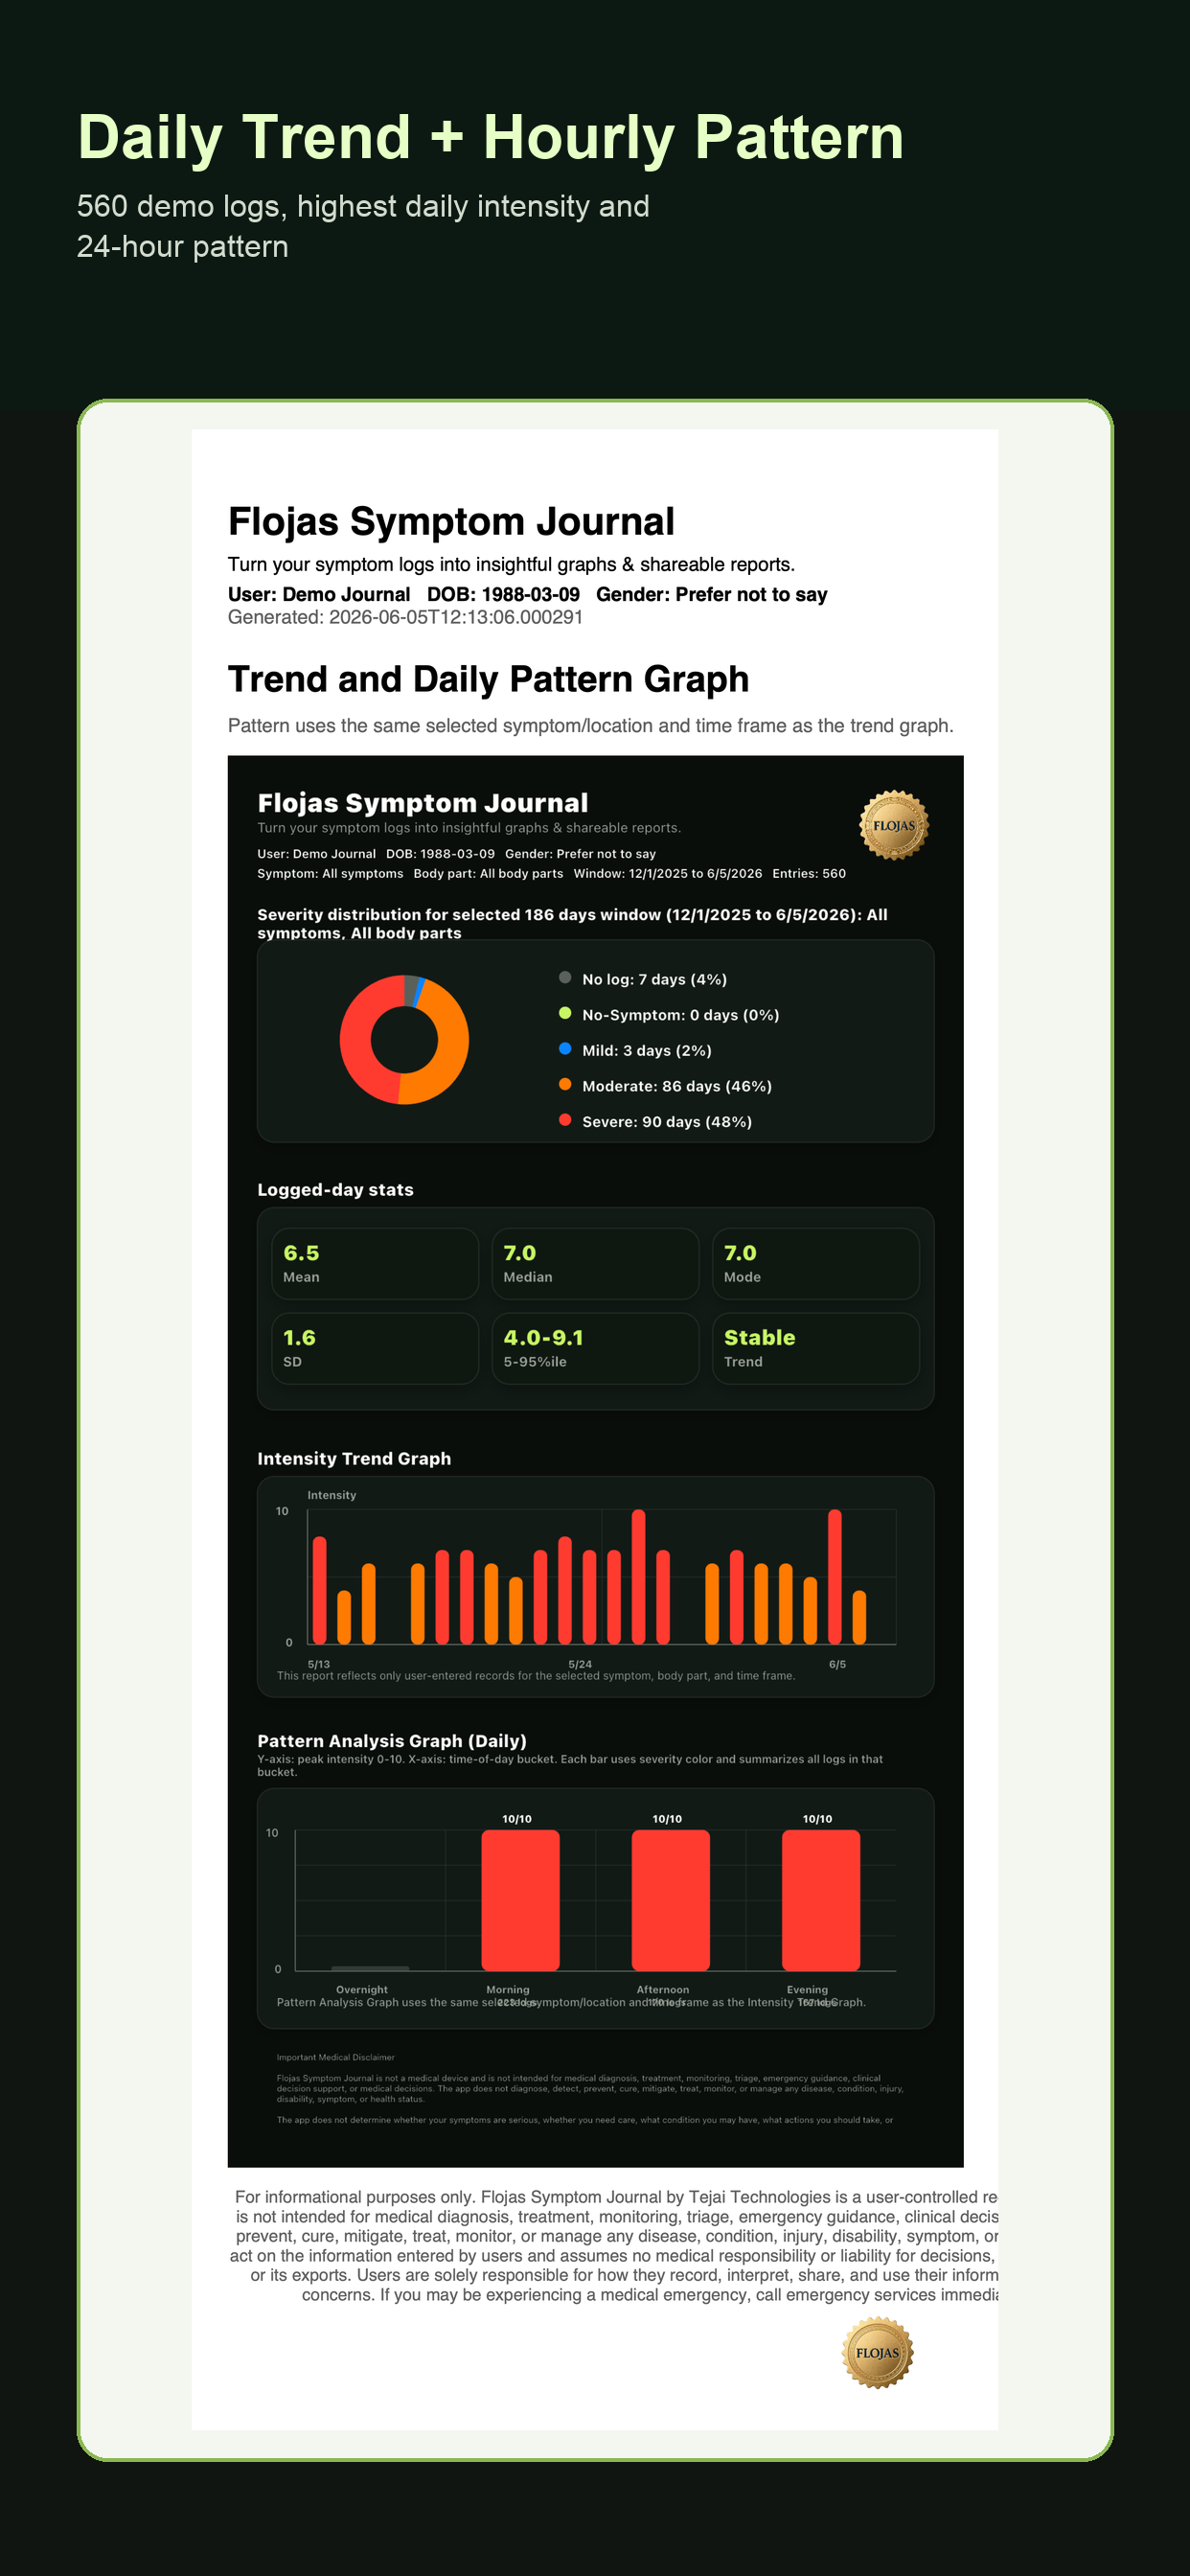
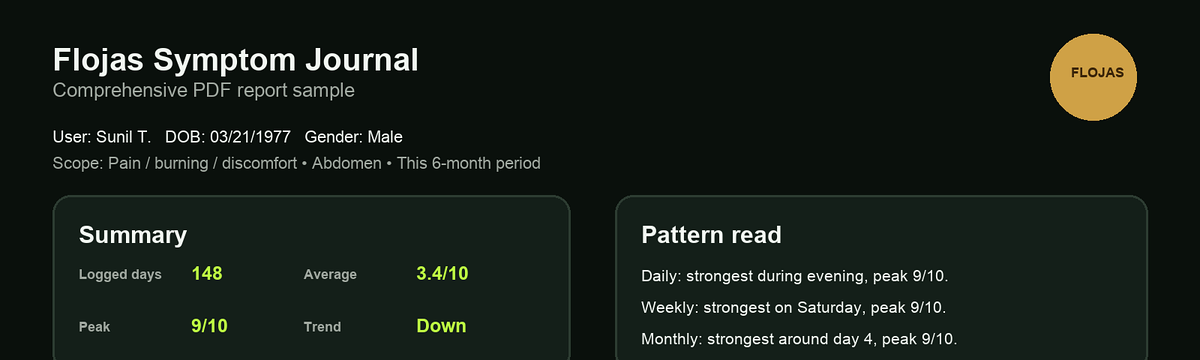
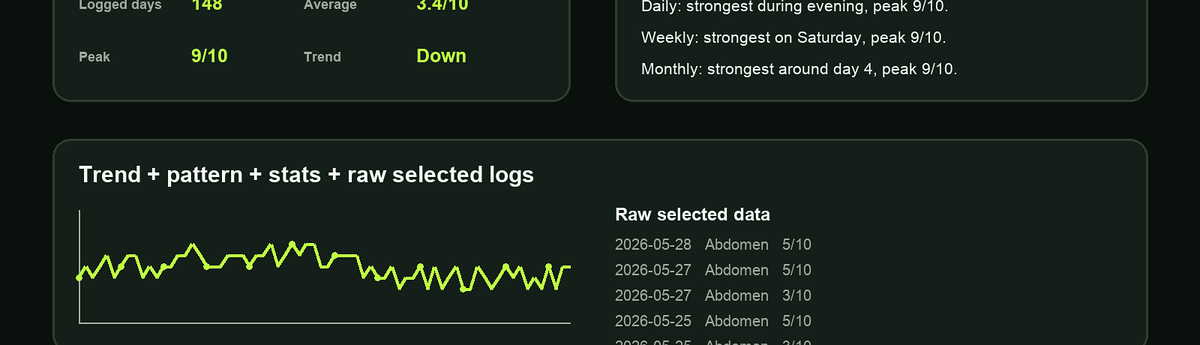
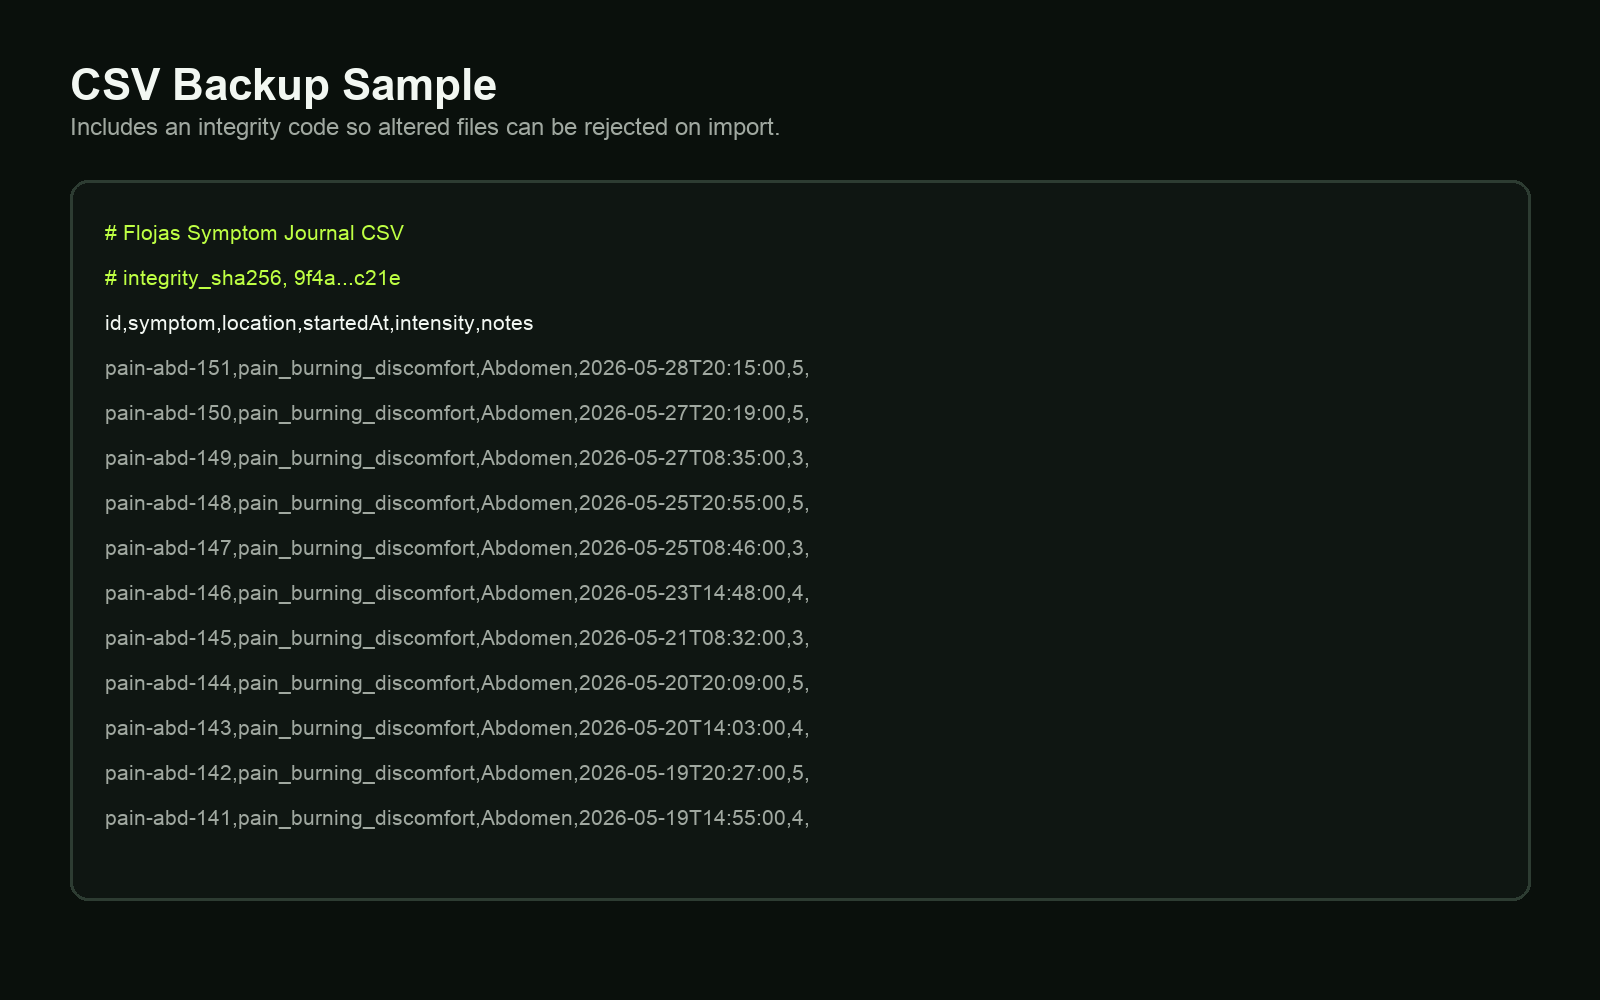
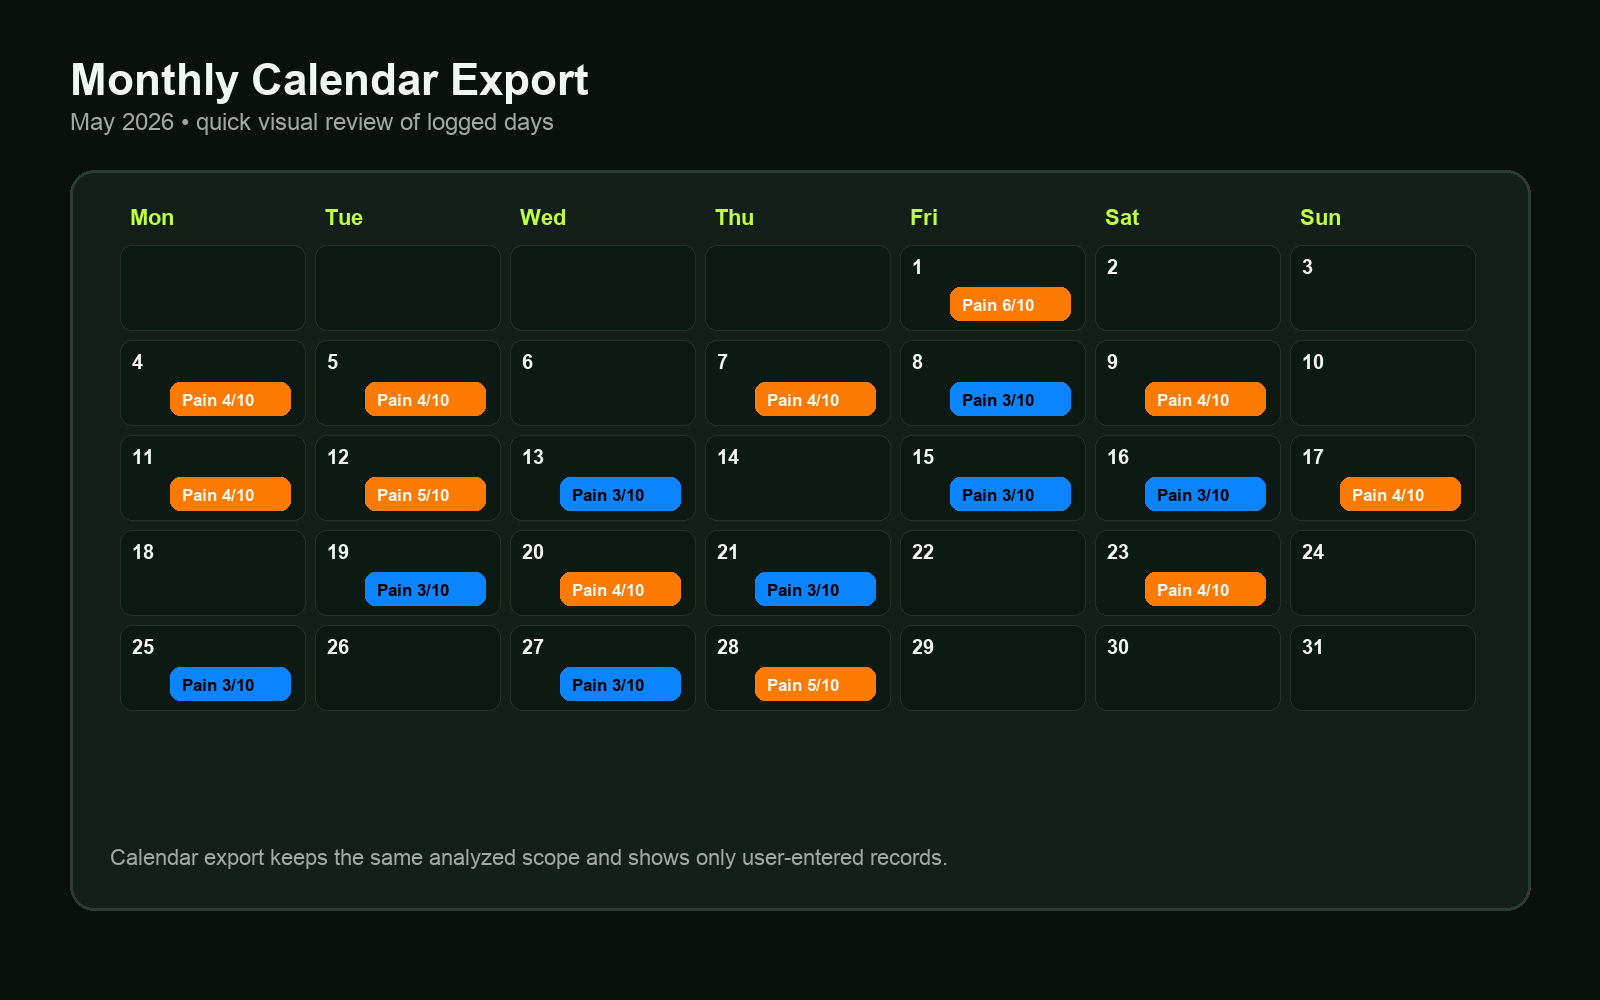
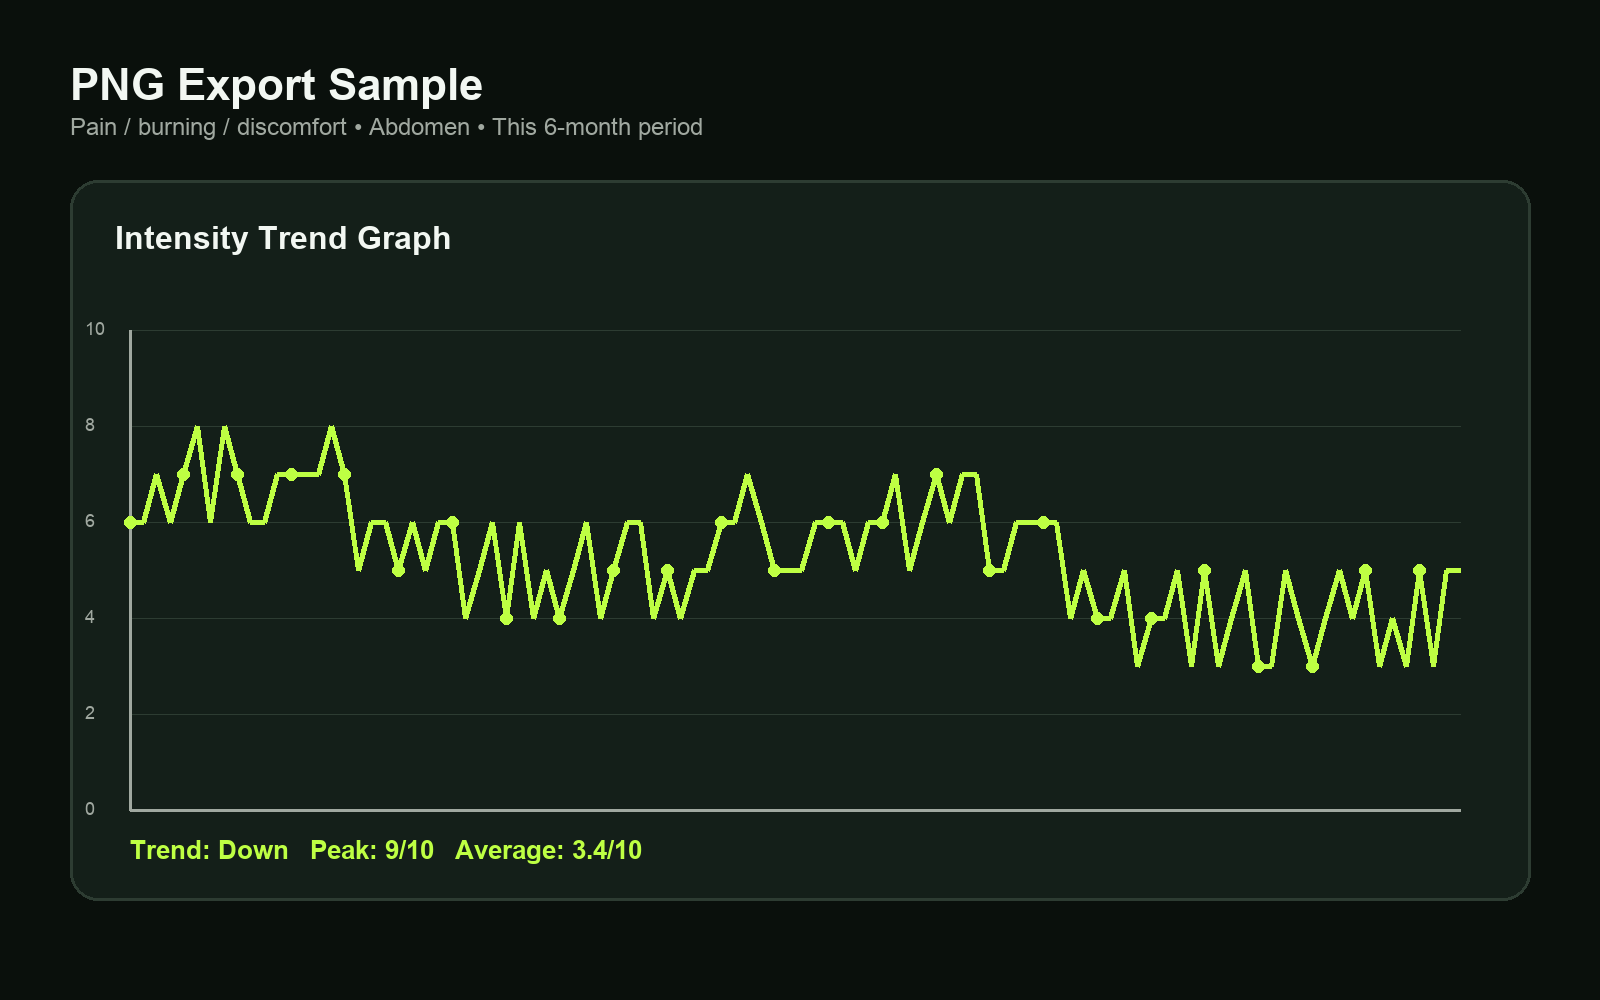
Export CSV, PNG, calendar, and PDF reports when you want a package for personal records or an appointment.
This short tour shows the app flow from private logging to graph and report generation.
Features and how-to guidance now live together on the homepage, so visitors can see the product in one natural sequence.
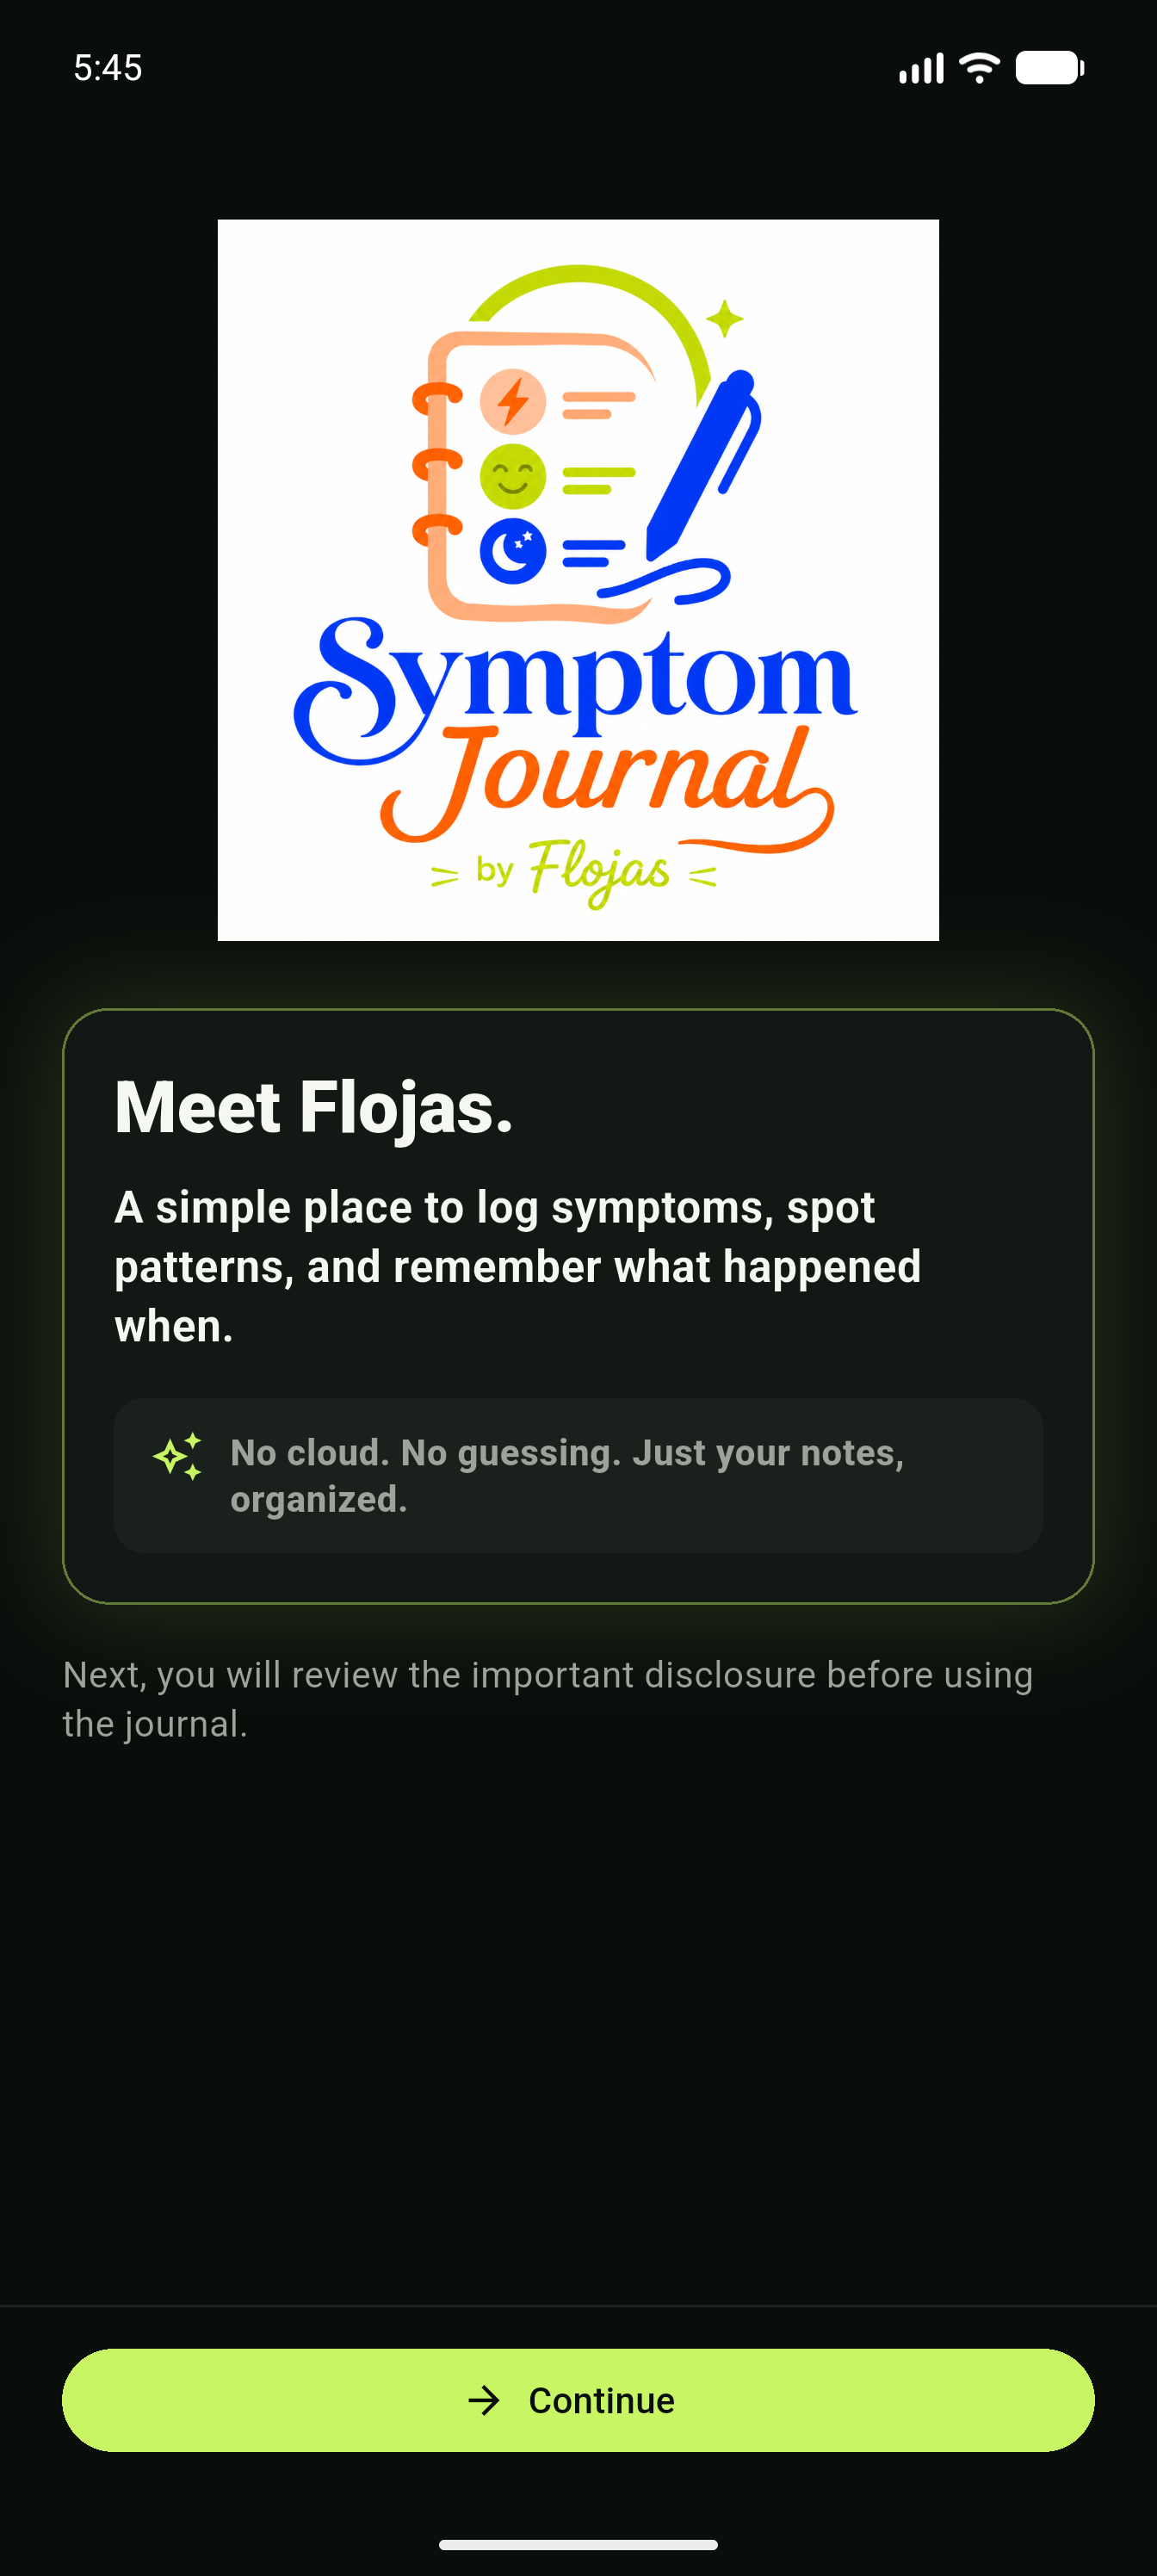
First-run screens make privacy, restore, language, and setup choices explicit before users begin recording health information.
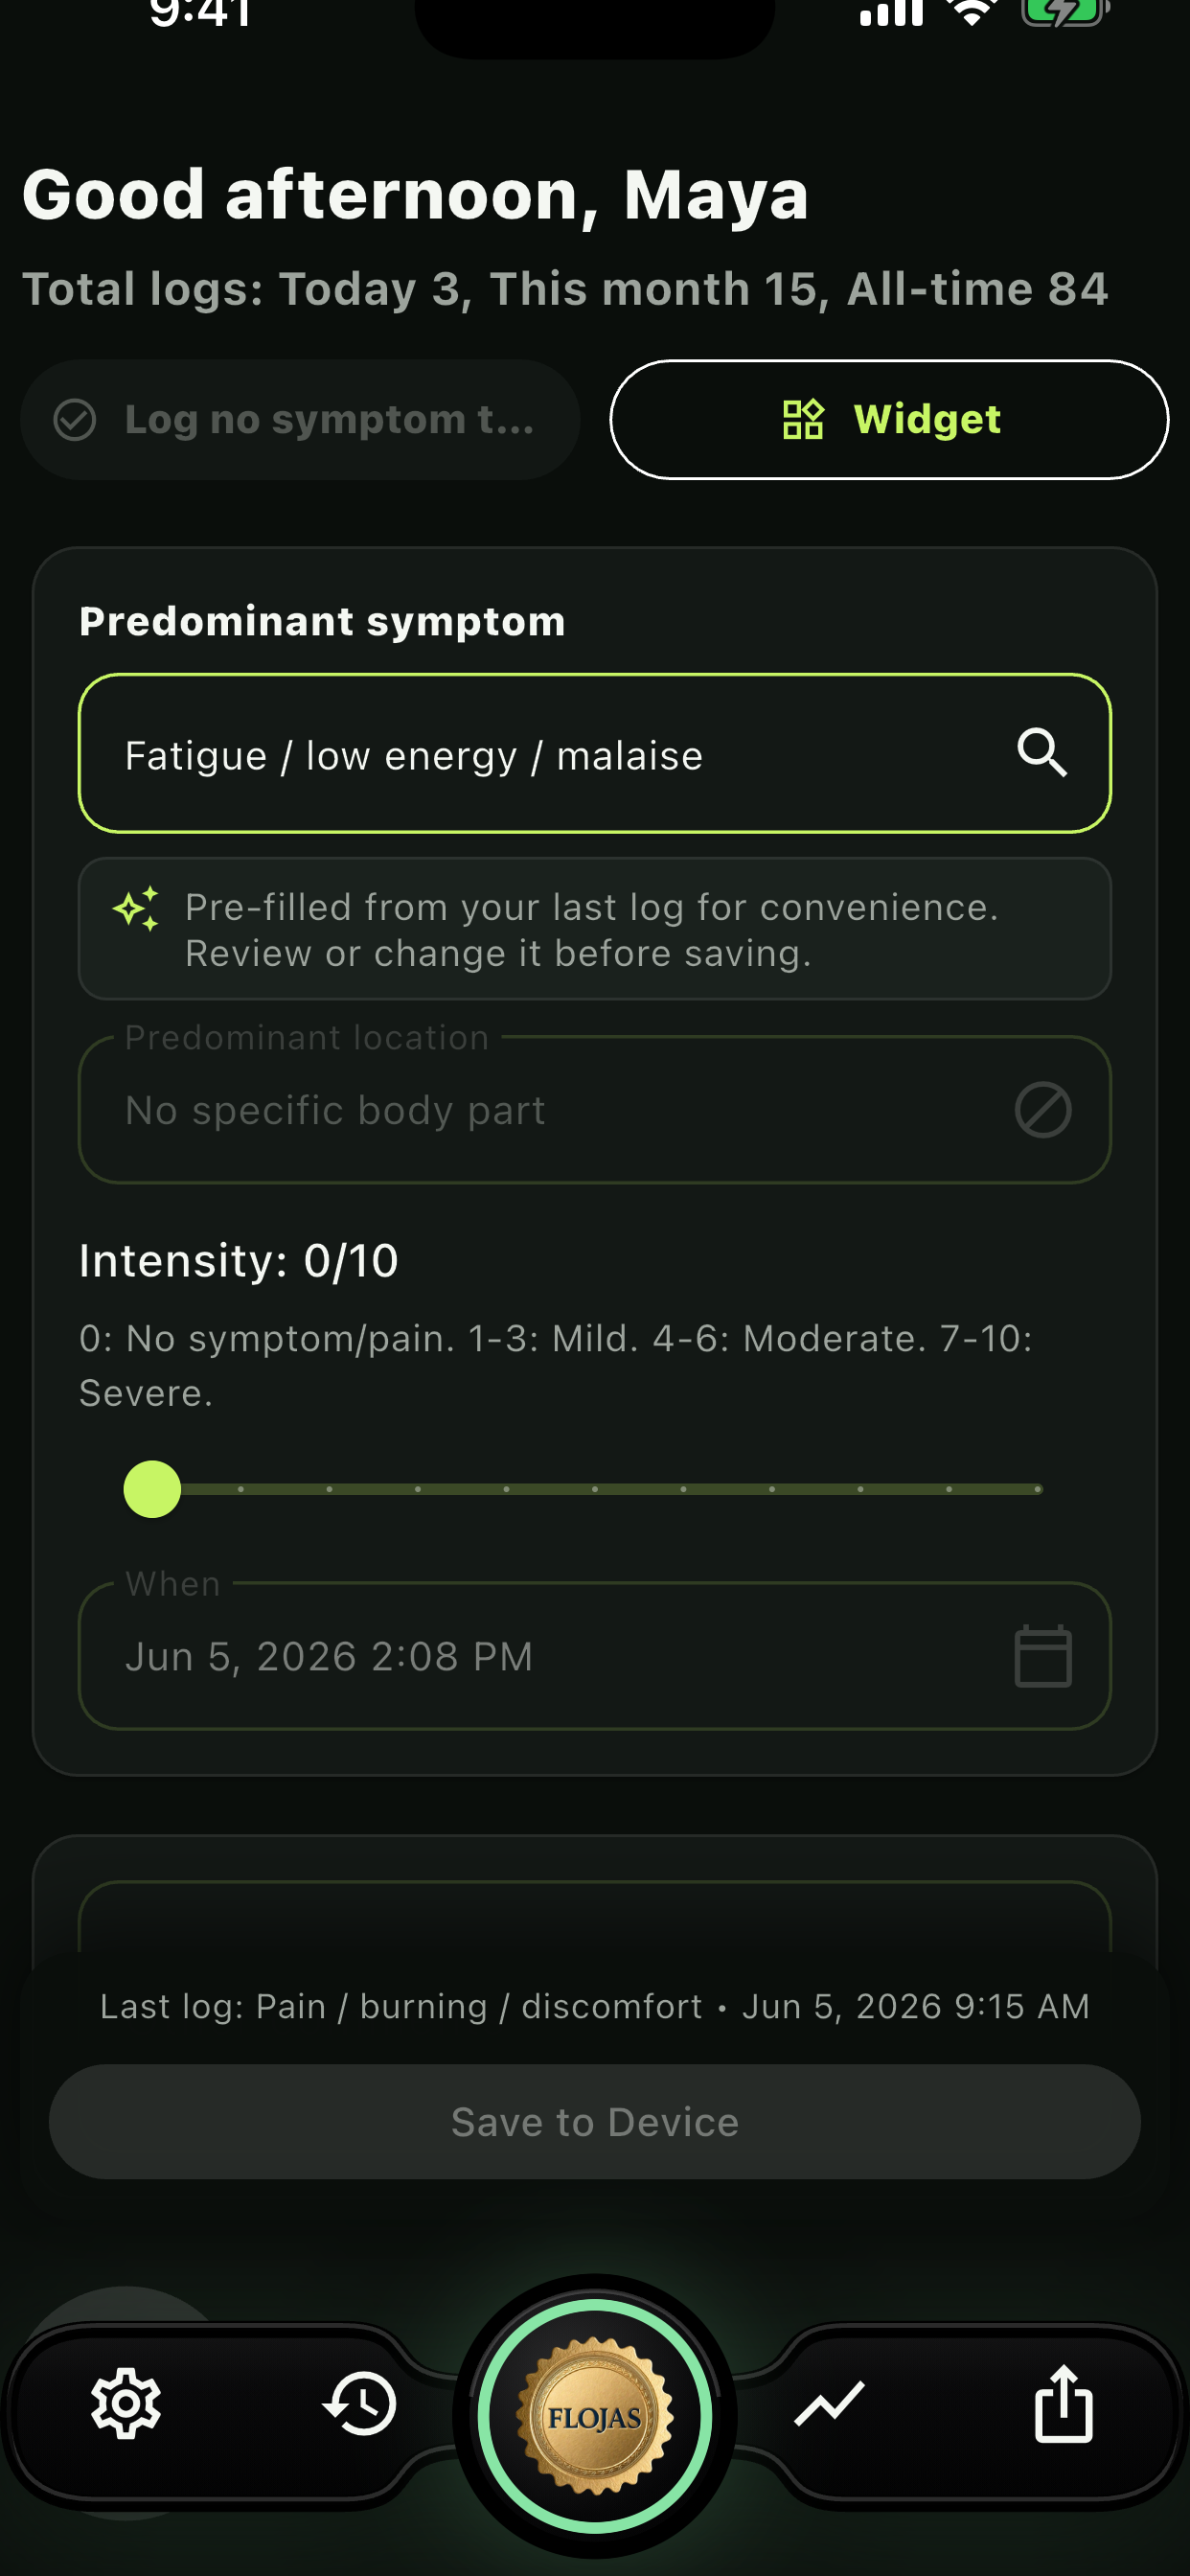
Record symptom, body area, intensity, notes, and timing in a local-first journal designed for repeat use.
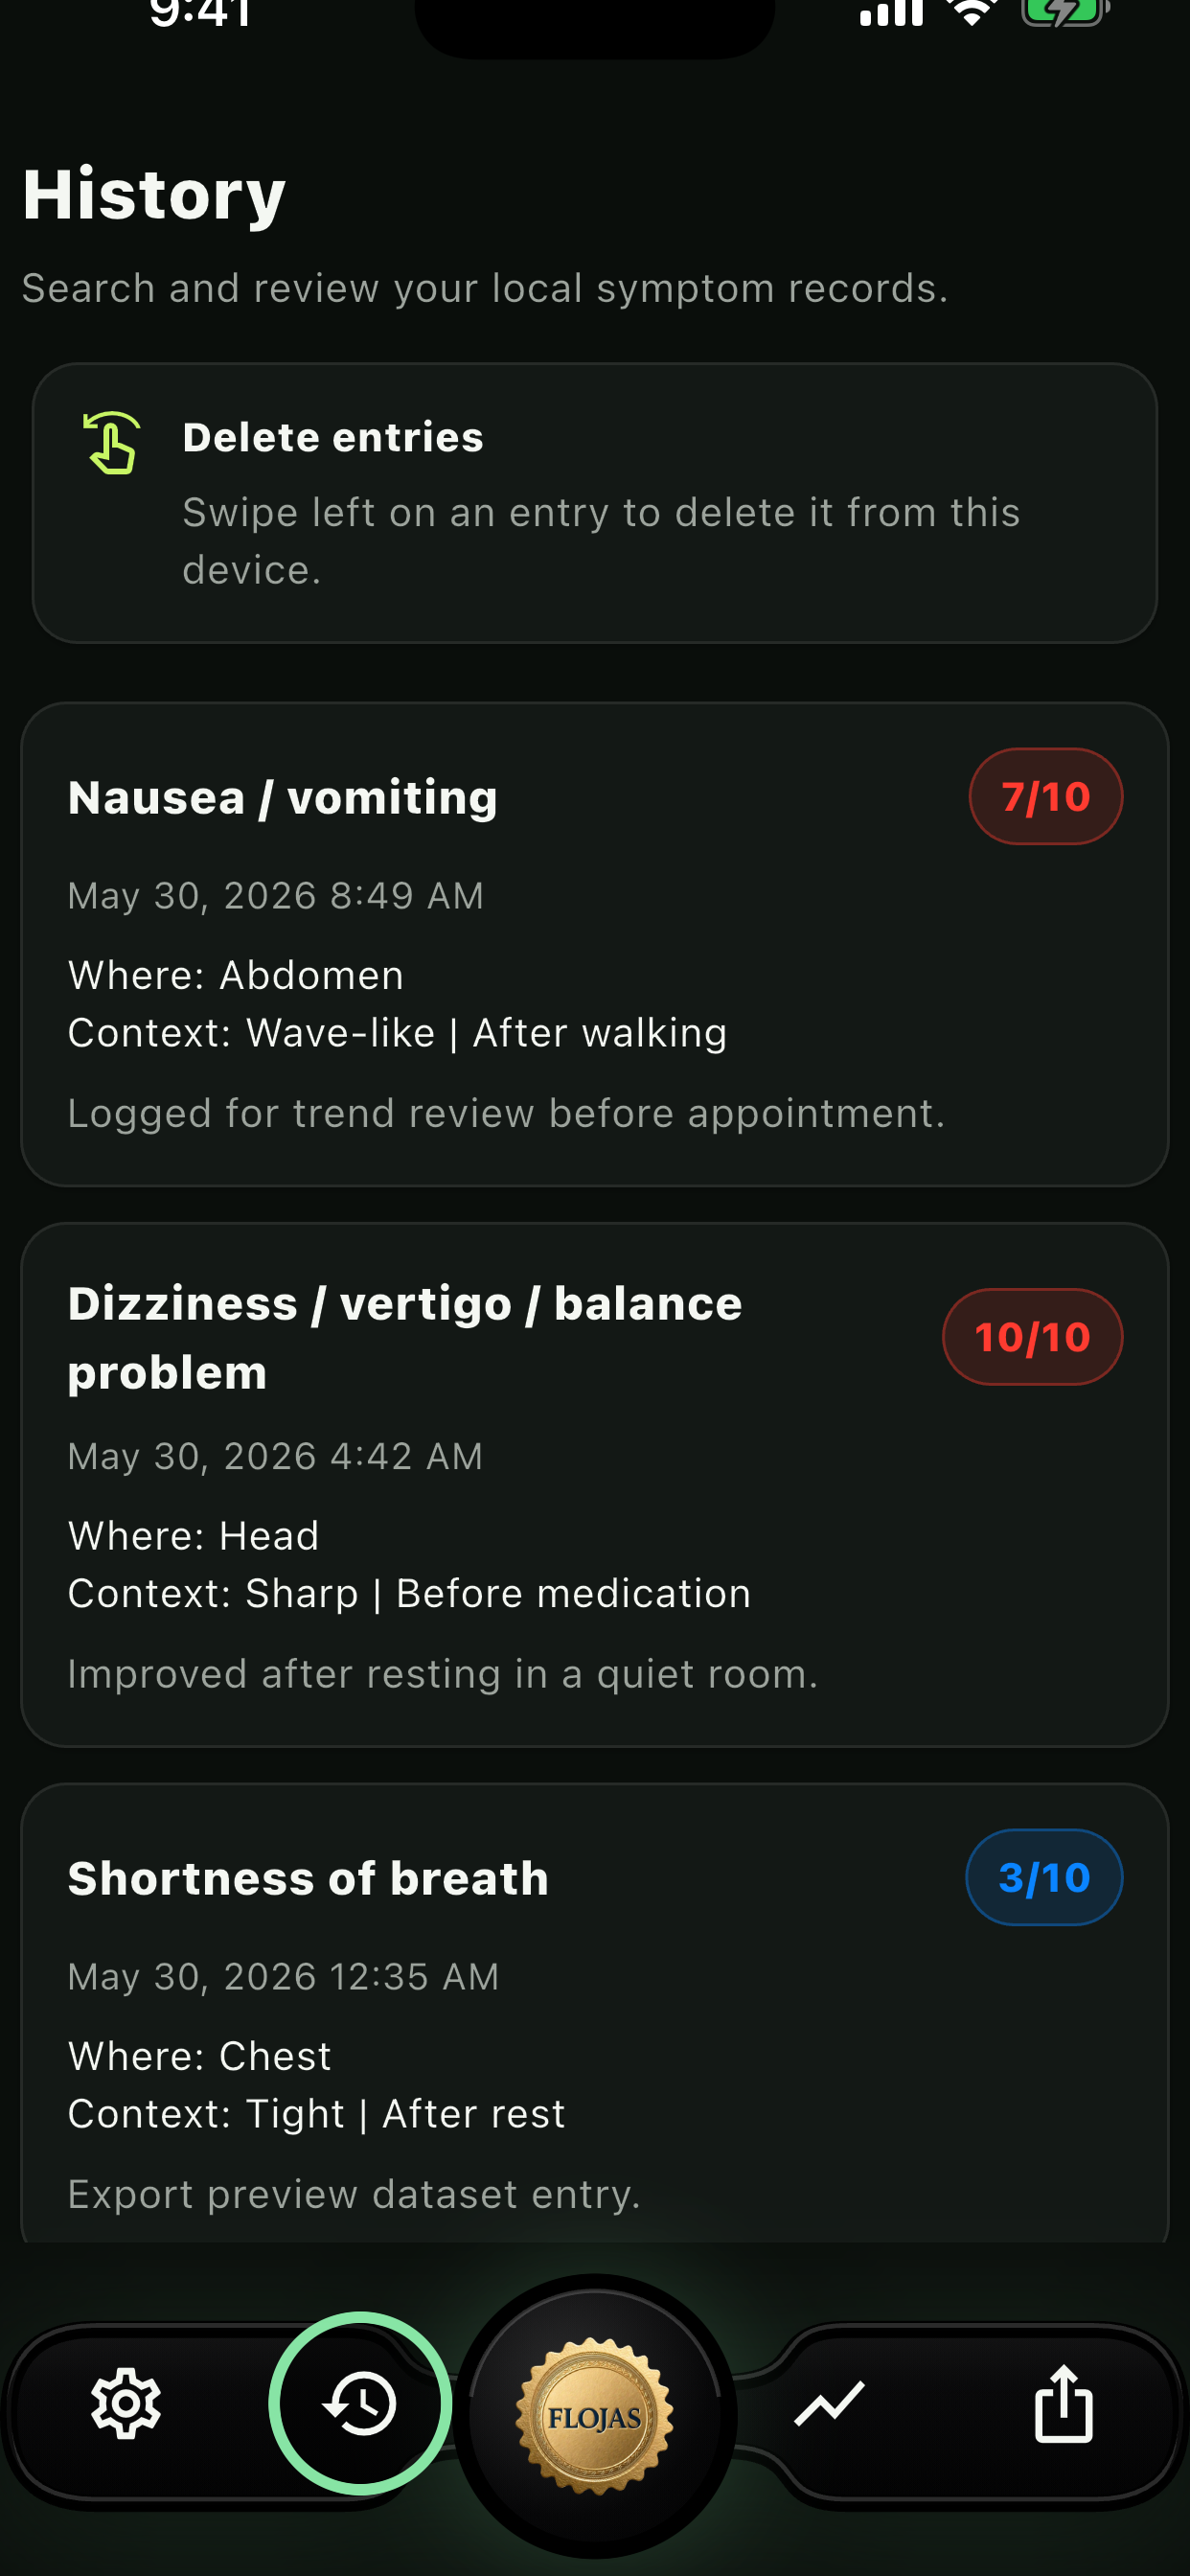
Saved entries remain on the device and can be reviewed, edited, deleted, exported, or restored by the user.
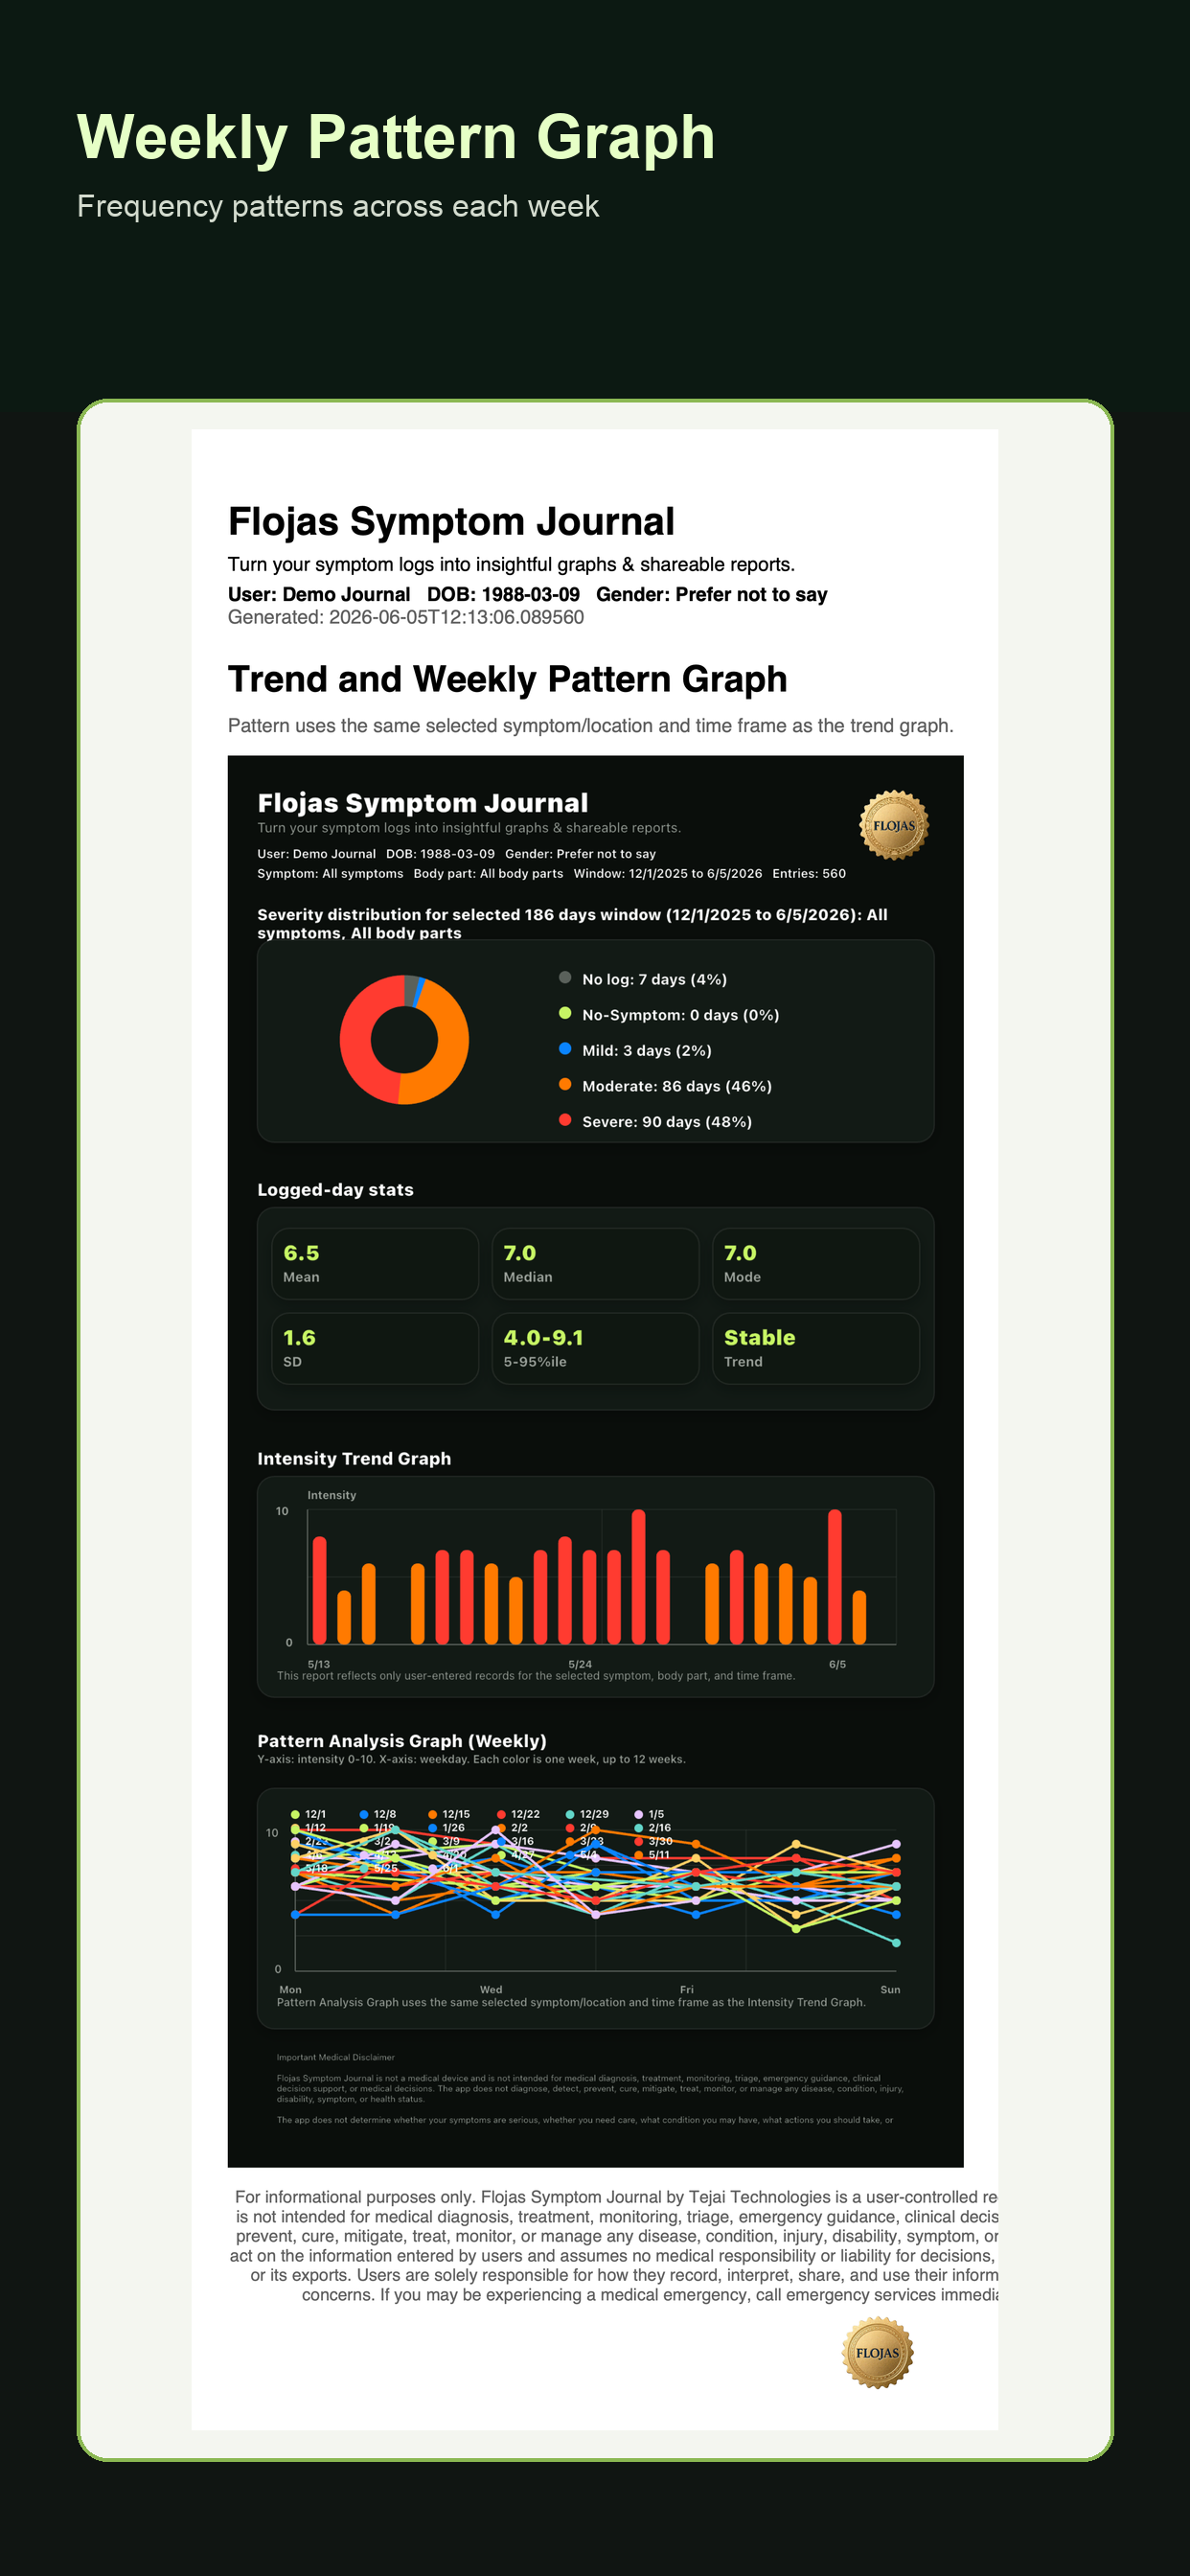
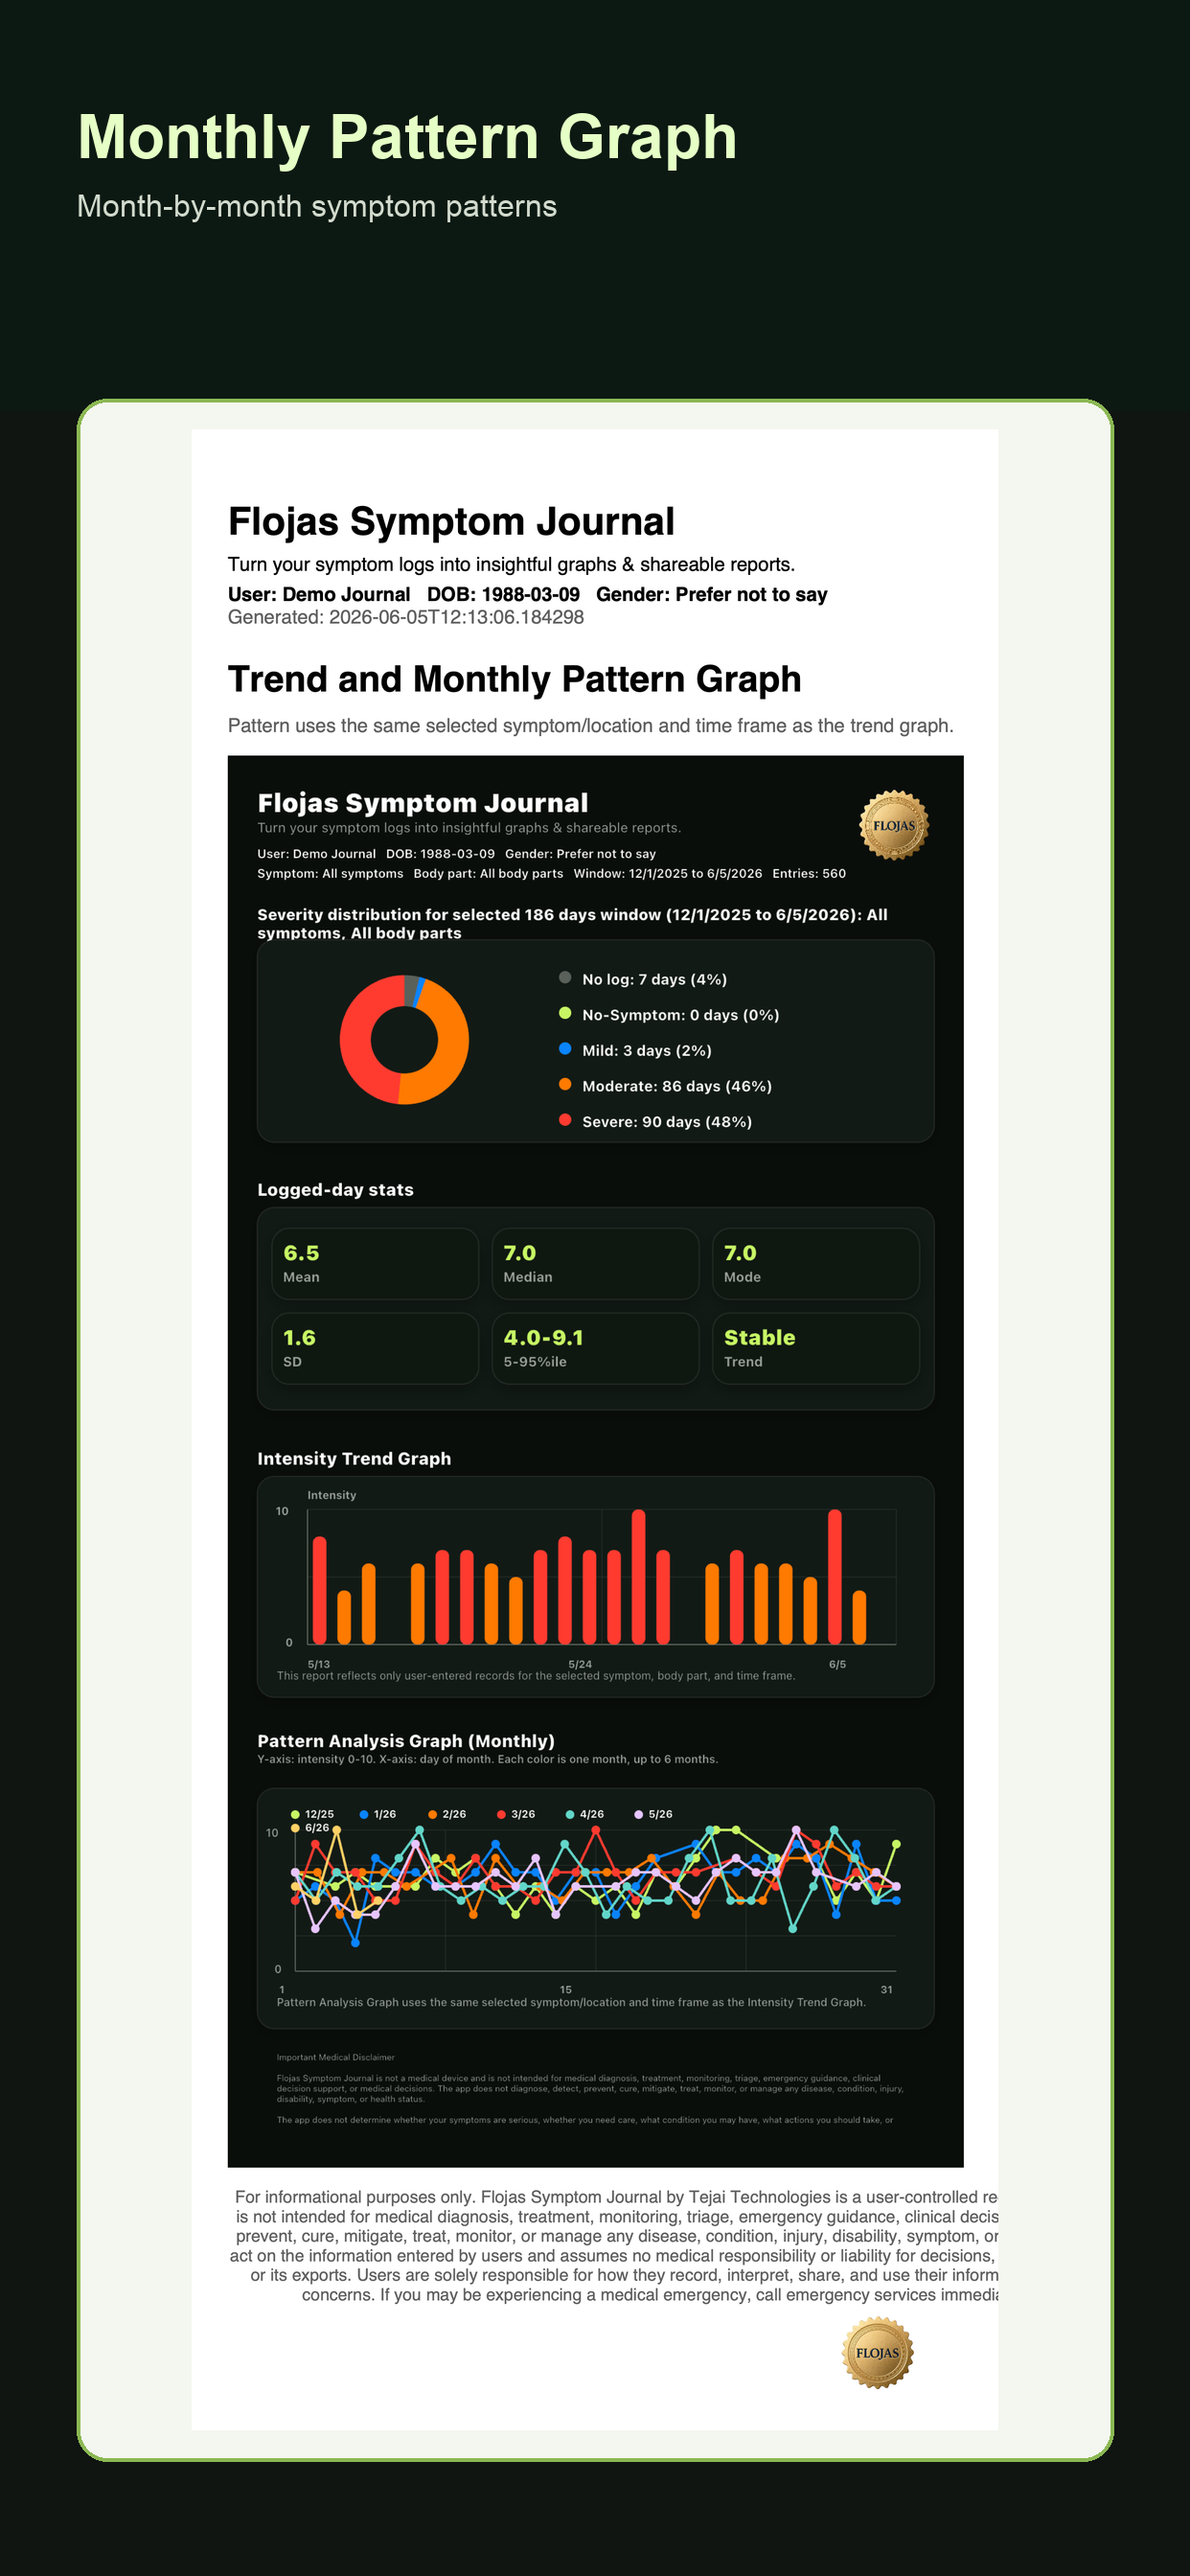
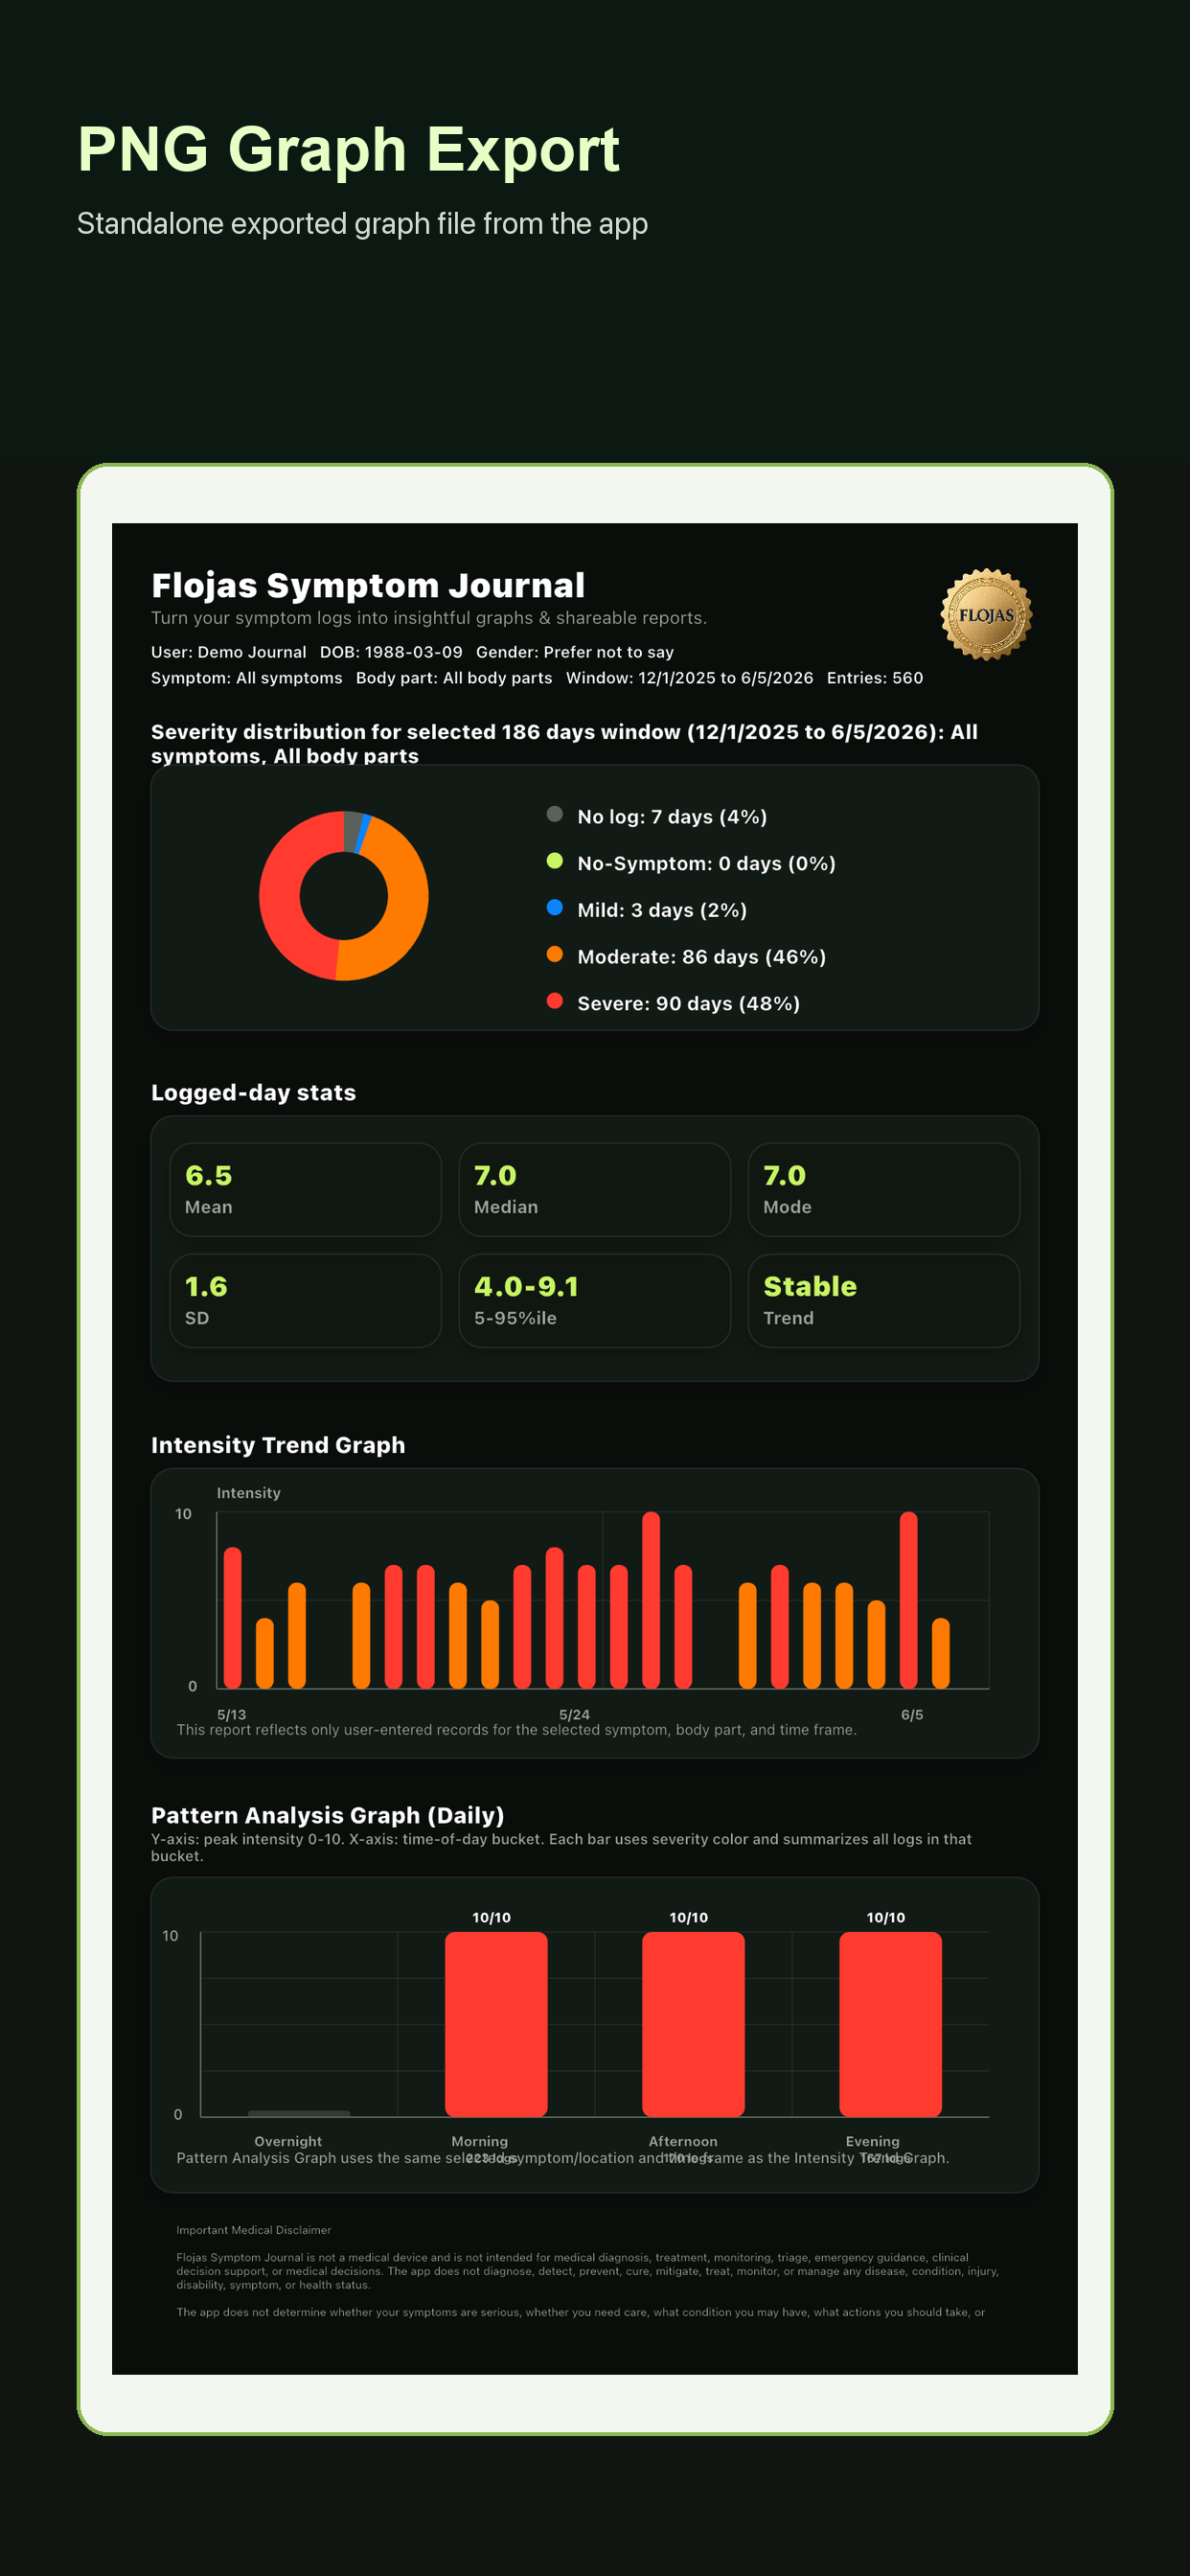
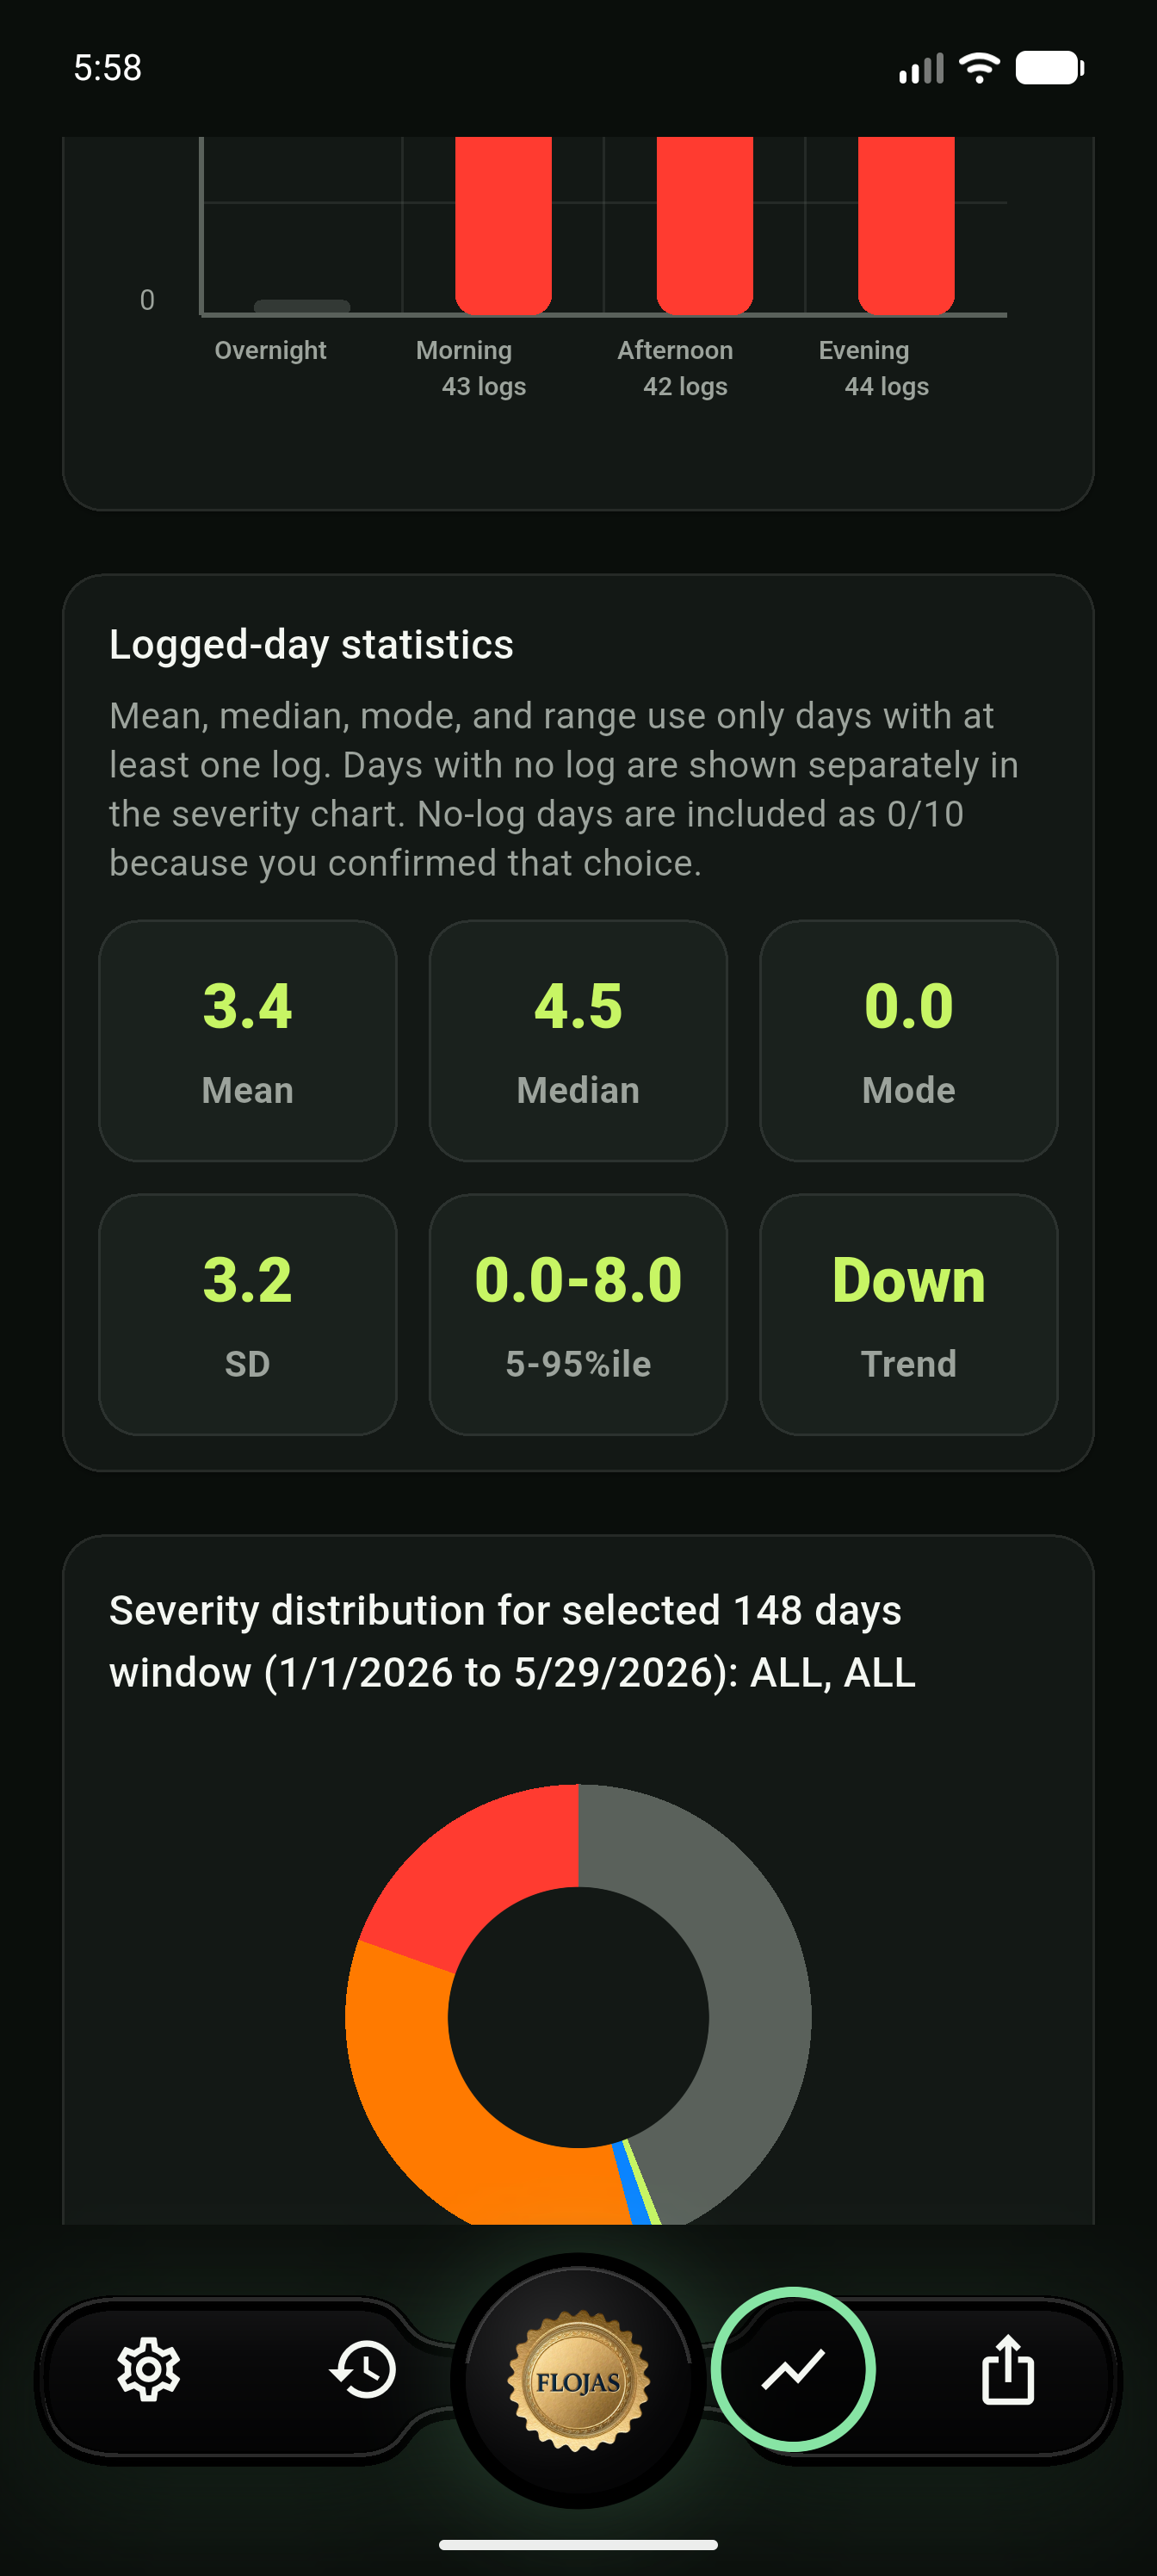
Daily, weekly, monthly, and trend views help users notice how recorded symptoms change over time.
PDF, CSV, PNG, and calendar-style outputs help users keep and share their own records when they choose.
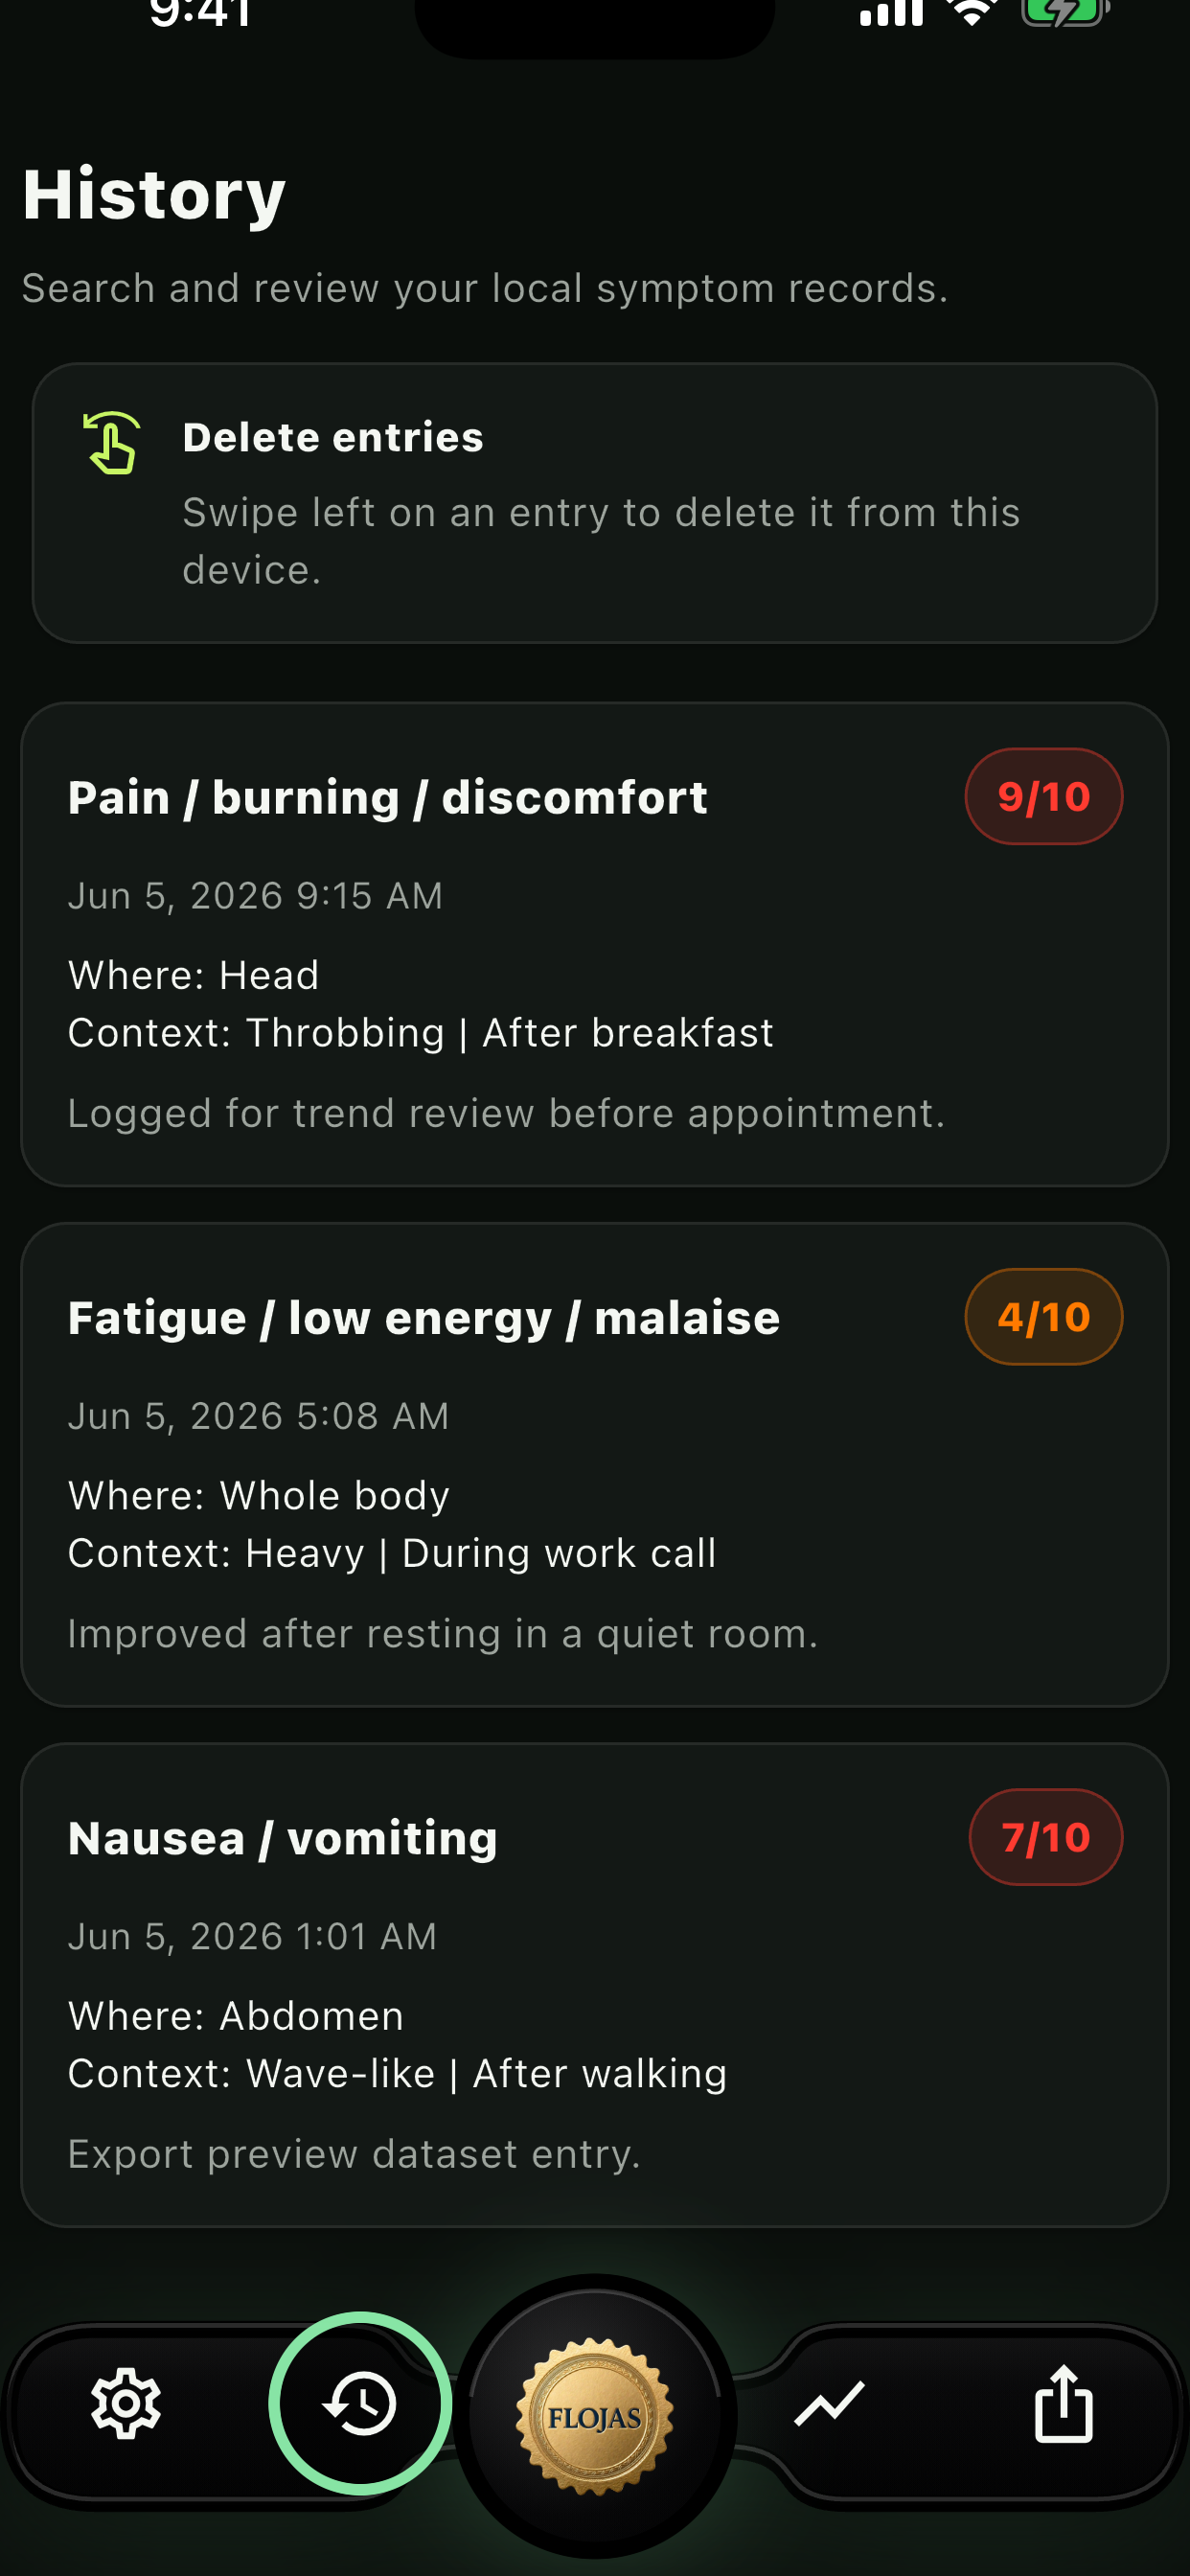
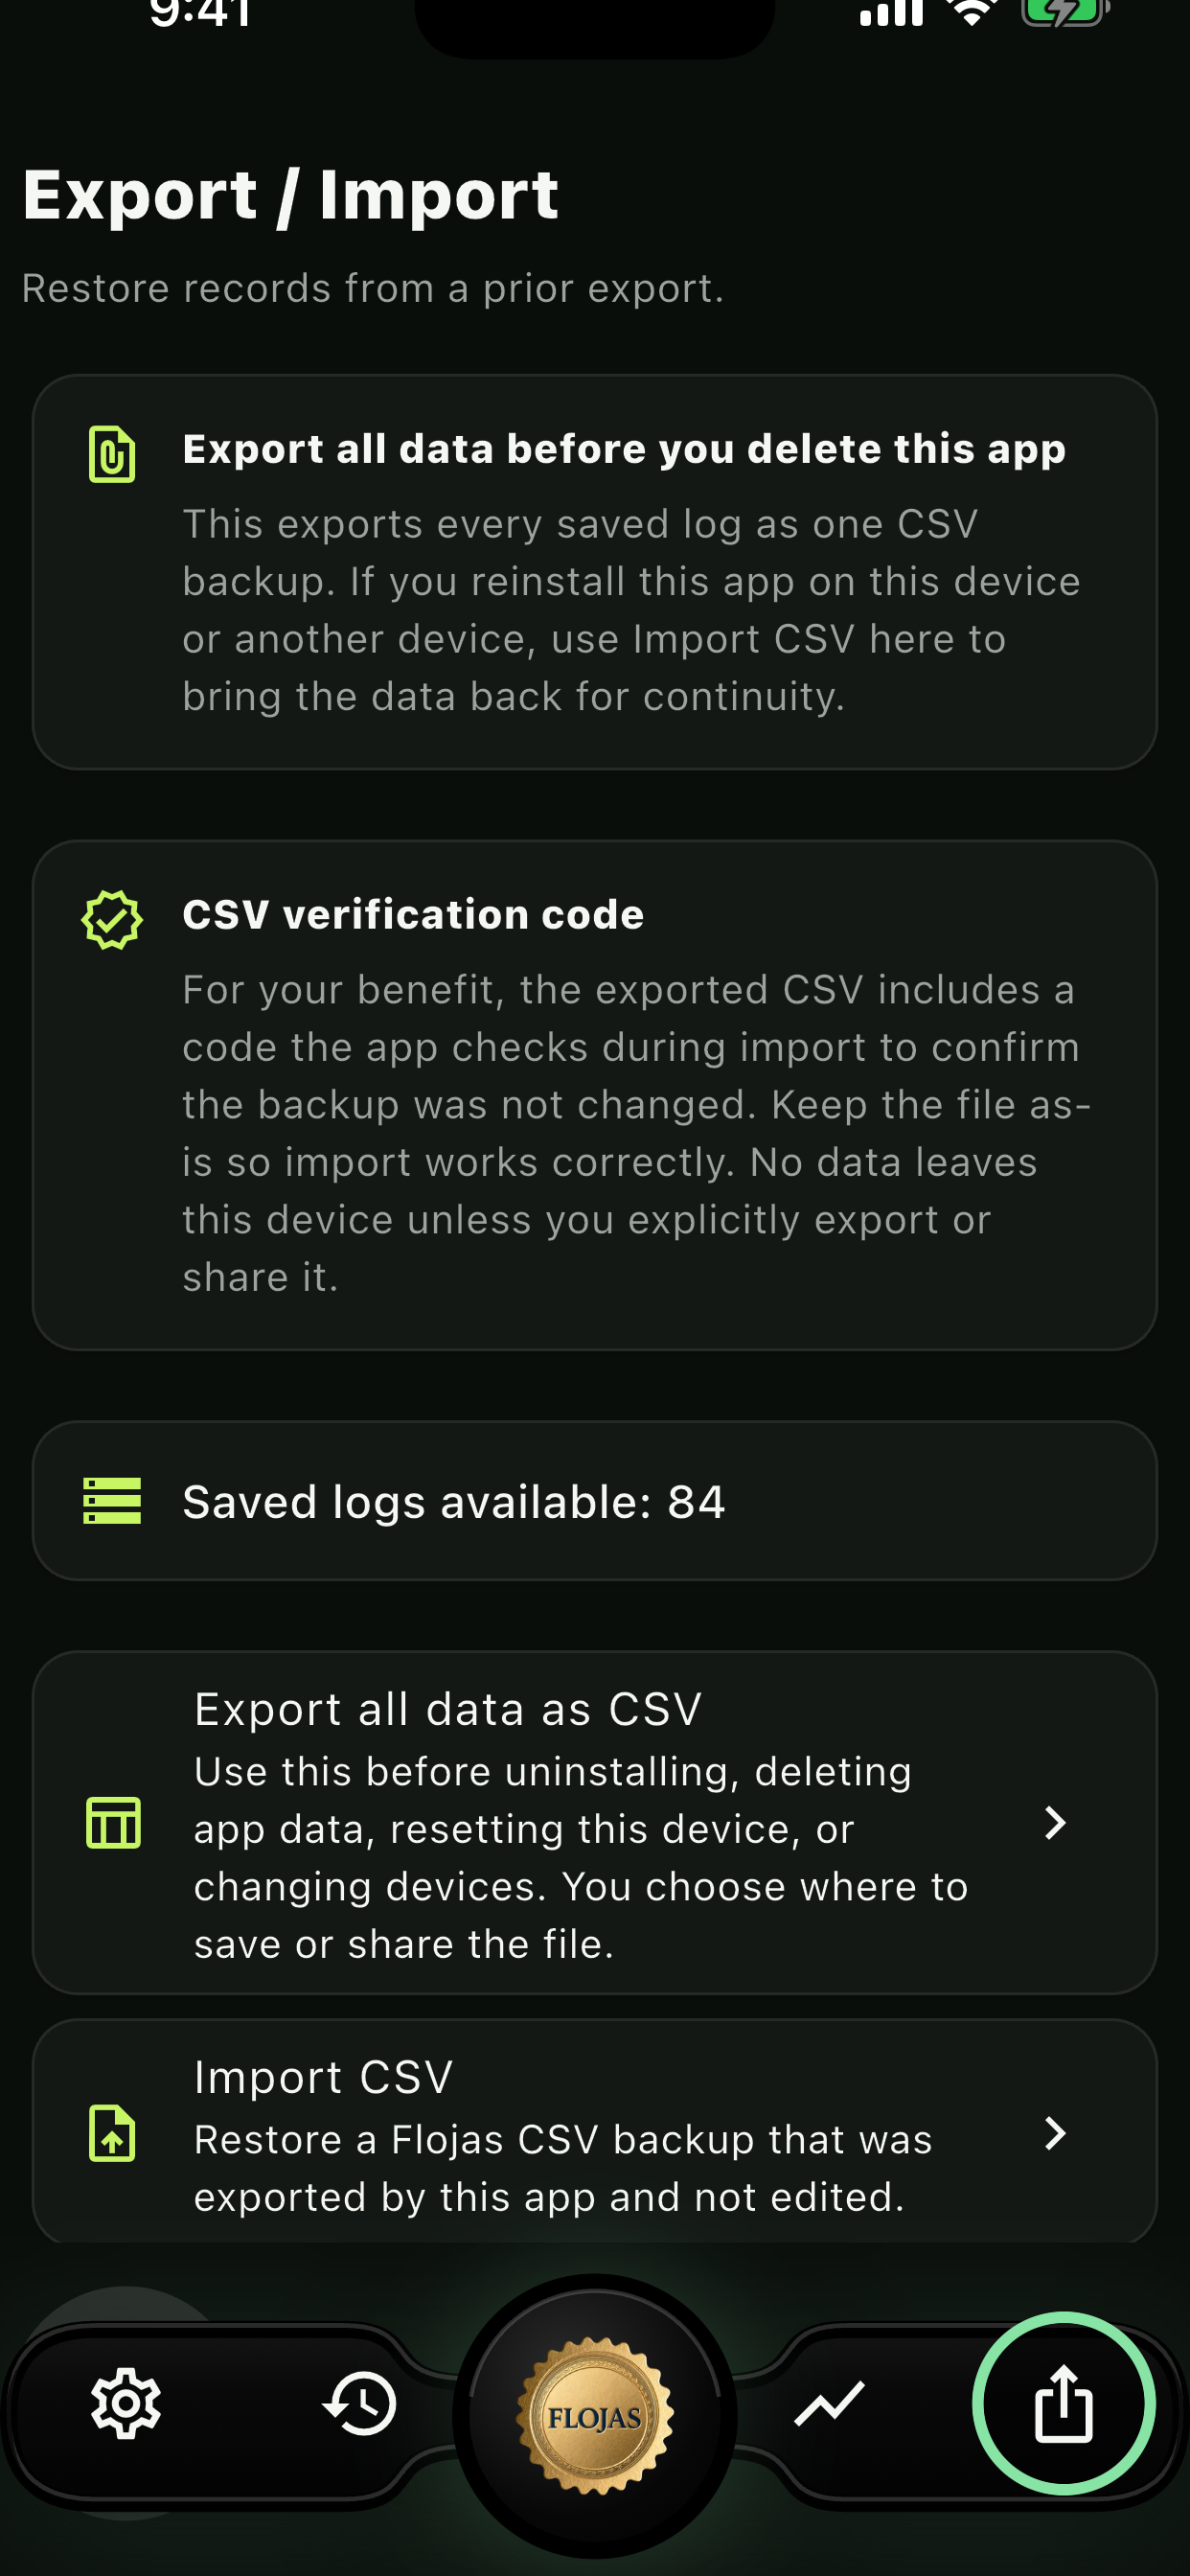
The latest screenshot set uses a richer sample dataset so visitors can see detailed entries, varied intensities, saved-log counts, and the app areas used before graph generation.
Symptom Journal is more than a diary. It turns user-entered logs into trend graphs, pattern views, PDF summaries, CSV files, PNG graph exports, and calendar-style snapshots.
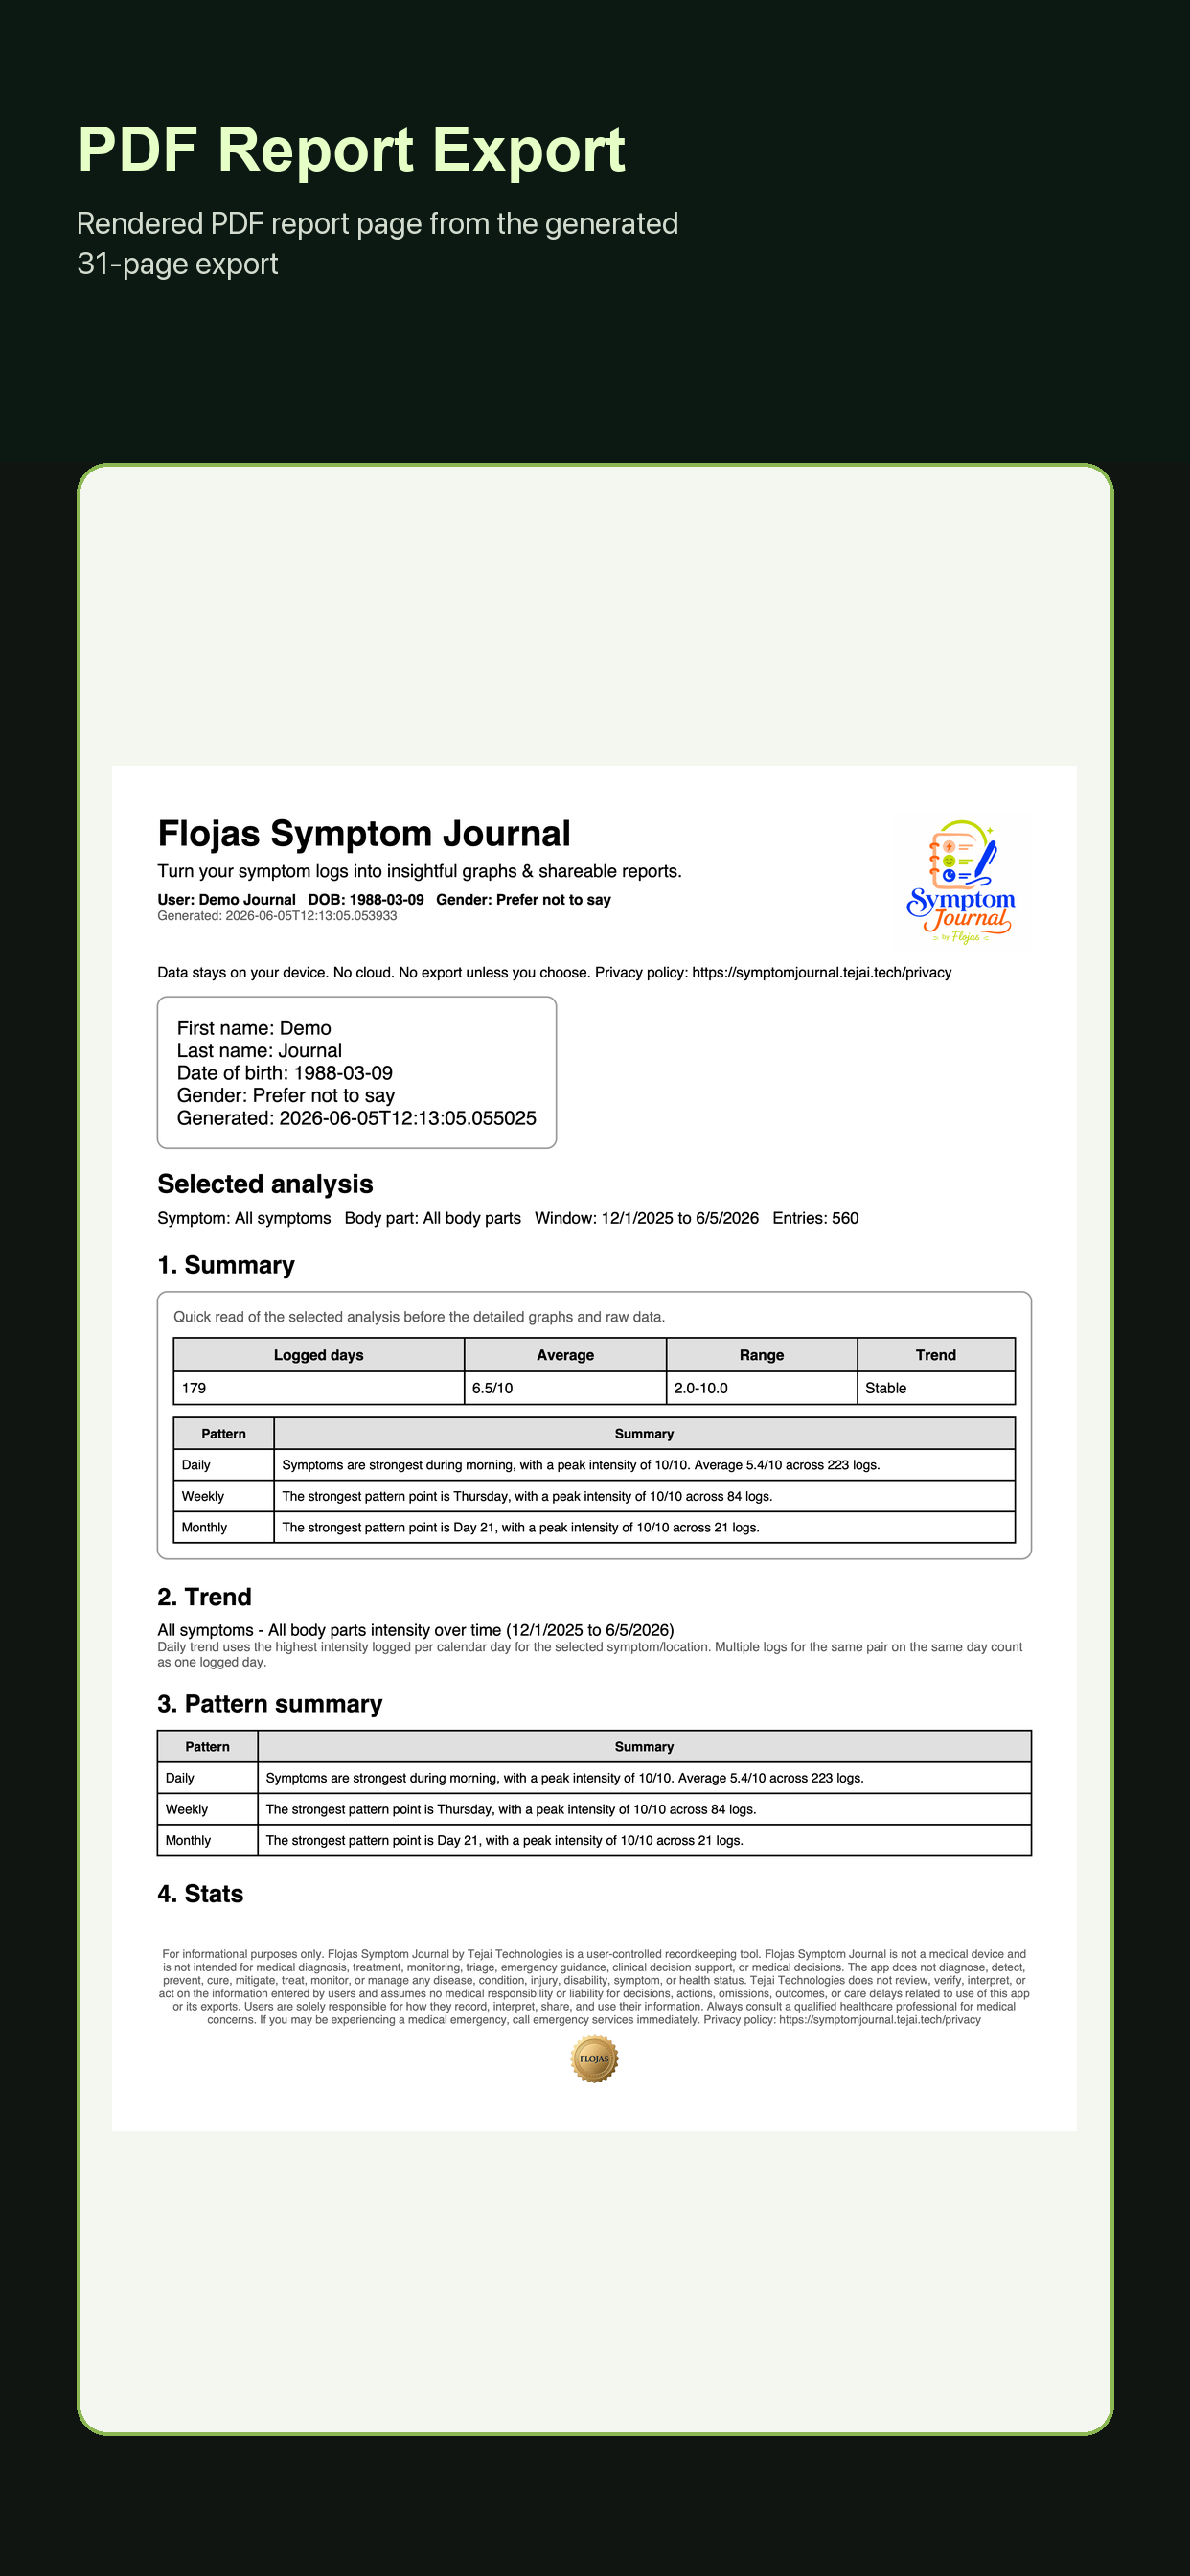
Records are stored locally in the current version. Export, import, share, and delete actions are initiated by the user. The app records and summarizes; it does not diagnose or tell anyone what medical action to take.
Local first. No account is required to use the app.
User controlled. Exports and sharing happen only when the user chooses.
Transparent outputs. PDF and CSV reports keep raw records visible.
Flojas Symptom Journal follows the teJai Technologies principle that useful tools should reduce confusion, protect human judgment, and make privacy promises visible in the way the product works.
The Play Store privacy URL stays unchanged and remains available from the main navigation.
Contact teJai Technologies and find backup, deletion, and privacy support notes.
Return to the developer website for the parent company and other teJai work.